Stacked Area graph like in MS Excel

TeeChart VCL for Borland/CodeGear/Embarcadero RAD Studio, Delphi and C++ Builder.
Post Reply
Den
Newbie
Newbie
Posts: 1
Joined: Wed May 03, 2006 12:00 am

Stacked Area graph like in MS Excel

Post by Den » Wed May 27, 2009 6:27 pm

Hello,
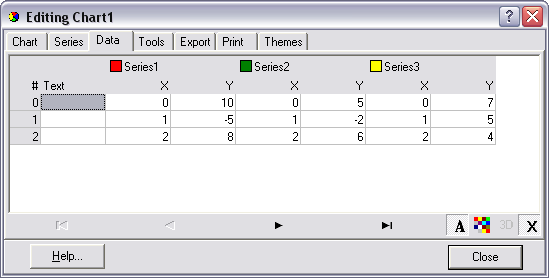
I have created a simple stacked area chart.
It contain 3 series with 3 points at each, and filled it with data like on the picture:
Image

and I got this result:
Image

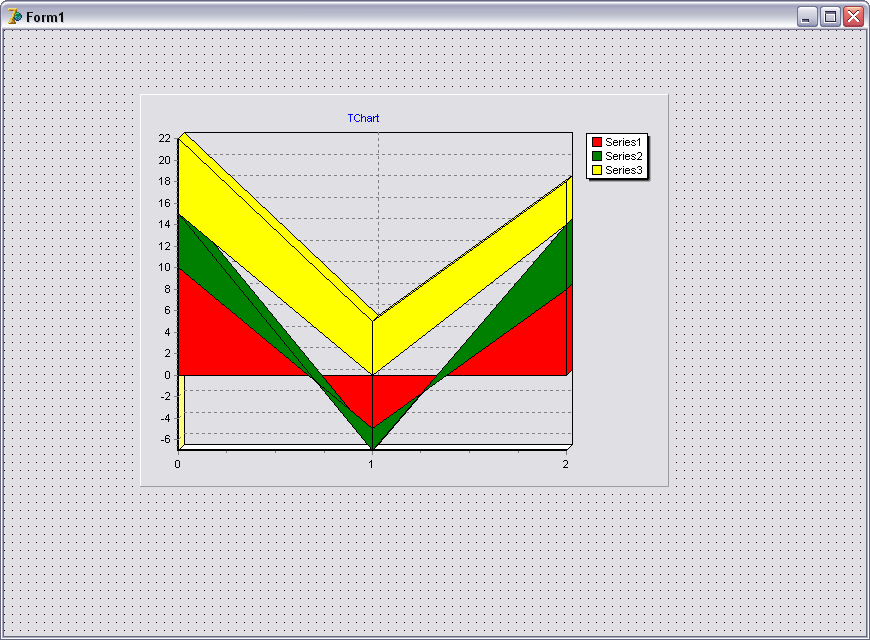
but same chart in "MS excel" looks different, it fills last series to the last negative point(from previous chart) , but teeChart fills last series to the zero point.

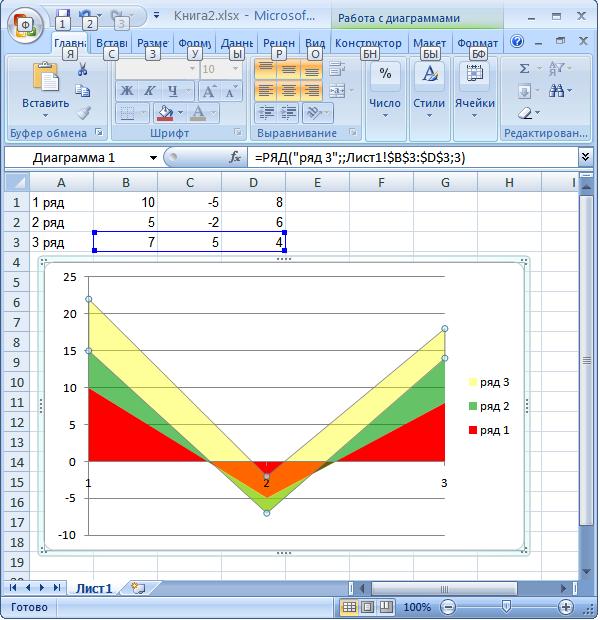
In "MS Excel" this chart looks like on this picture:
Image

So my question is :
Does it possible to create stacked aria chart like in "MS Excel" ?

I'm using TeeChart 7.07 pro.
Thanks.

Yeray
Site Admin
Site Admin
Posts: 9602
Joined: Tue Dec 05, 2006 12:00 am
Location: Girona, Catalonia
Contact:

Post by Yeray » Thu May 28, 2009 8:19 am

Hi Den,

Yes you are right. I've added it to the wish list to be fixed in further releases (TV52014194). Thank you for reporting this.
Best Regards,
ImageYeray Alonso
Development & Support
Steema Software
Av. Montilivi 33, 17003 Girona, Catalonia (SP)
Image Image Image Image Image Image Please read our Bug Fixing Policy

Post Reply