
Hi,
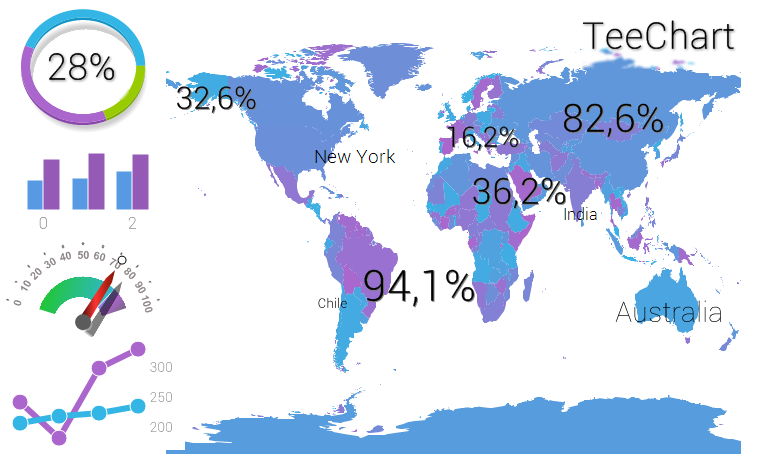
I have seen a couple of screens you've published, and noticed a dashboard with a donut with percentage in the middle.
http://www.steema.com/uploads/gallery/D ... eChart.png
How to do this with xe5 teechart pro last version?
Also I don't find how to make these percentages with different sizes with the map series.
Same question about flat design shown in
http://steema.com/entry/186/New_flat_de ... _products_
Thanks
Gonzalo
how to do a donut with percentage inside?
-
Narcís
- Site Admin

- Posts: 14730
- Joined: Mon Jun 09, 2003 4:00 am
- Location: Banyoles, Catalonia
- Contact:
Re: how to do a donut with percentage inside?
Hi Gonzalo,
To get you started, you can find a similar example here.tecsidel wrote: I have seen a couple of screens you've published, and noticed a dashboard with a donut with percentage in the middle.
http://www.steema.com/uploads/gallery/D ... eChart.png
How to do this with xe5 teechart pro last version?
We will post examples for your other requests as soon as possible.tecsidel wrote: Also I don't find how to make these percentages with different sizes with the map series.
Same question about flat design shown in
http://steema.com/entry/186/New_flat_de ... _products_
Best Regards,
| Narcís Calvet / Development & Support Steema Software Avinguda Montilivi 33, 17003 Girona, Catalonia Tel: 34 972 218 797 http://www.steema.com |
      |
| Instructions - How to post in this forum |
Re: how to do a donut with percentage inside?
Hi Gonzalo,
Then, in the case for the Donut series example, you have to specify the hole percent as desired, and add an Annotation tool, which you can position it wherever you want inside the Chart bounds (for example at the hole center), setting a specific font size and family.
The three examples can be easily done, all of them have been done at design time, by using the Chart Editor. First of all, you have to set the Flat theme for the Chart, and the Android palette, this will make to change the chart aspect considerably.I have seen a couple of screens you've published, and noticed a dashboard with a donut with percentage in the middle.
http://www.steema.com/uploads/gallery/D ... eChart.png
How to do this with xe5 teechart pro last version?
Then, in the case for the Donut series example, you have to specify the hole percent as desired, and add an Annotation tool, which you can position it wherever you want inside the Chart bounds (for example at the hole center), setting a specific font size and family.
About the Map example, as others I used the Chart editor, with map series, adding some Annotation tools to the Chart, setting its position, and font size for each. Although, this can be make by code, specially the case that the annoation size is suposed to change depending on the data.Also I don't find how to make these percentages with different sizes with the map series.
About the horizontal bar example, I used the Flat theme again, but this time I used a custom color palette, setting each bar color by my own, and change some Chart aspect properties at design time, like pens, fonts, axis, etc.. I've attached the vcl sample to a this post (almost all done at design time).Same question about flat design shown in
- Attachments
-
- horizbar_flat.rar
- (2.65 KiB) Downloaded 606 times
Pep Jorge
http://support.steema.com
http://support.steema.com