
I am using a surface series chart. Even when I have 100 x, and 100 z points the chart appears as a rectangle, not a square. How can I fix the aspect ratio of the chart so that it appears as a square.
Thanks in advance for any help.
Aspect Ratio of Chart

Hi jenb,
If your chart axes are longer for X values than in Y values (or reverse), the axis is auto-scaled to fit you series values. I you want the axis "proportional", you could do something similar than the demo at Welcome !\Axes\Isometric axes
If your chart axes are longer for X values than in Y values (or reverse), the axis is auto-scaled to fit you series values. I you want the axis "proportional", you could do something similar than the demo at Welcome !\Axes\Isometric axes
Best Regards,
 | Yeray Alonso Development & Support Steema Software Av. Montilivi 33, 17003 Girona, Catalonia (SP) |
      |
Please read our Bug Fixing Policy |
Hi jenb,
Some time ago I've made an example for a customer that asked for something similar, if I understand well. Here it is the topic. Note that this was made for VB6 and TeeChart ActiveX. If you find problems translating it, feel free to ask here and we'll try to help you.
Some time ago I've made an example for a customer that asked for something similar, if I understand well. Here it is the topic. Note that this was made for VB6 and TeeChart ActiveX. If you find problems translating it, feel free to ask here and we'll try to help you.
Best Regards,
| Yeray Alonso Development & Support Steema Software Av. Montilivi 33, 17003 Girona, Catalonia (SP) |
| |
Please read our Bug Fixing Policy |
Yeray
I looked at your example, but I can't use the code from it, quoted below, as HandleDC is no longer supported.
Regards
jenb
I looked at your example, but I can't use the code from it, quoted below, as HandleDC is no longer supported.
I am using the following codeXYScreen = (GetDeviceCaps(.Canvas.HandleDC, HORZSIZE) / Screen.Width) / (GetDeviceCaps(.Canvas.HandleDC, VERTSIZE) / Screen.Height)
Which is from your example in the features gallery. I am using a 3D surface chart but I only require the bottom and depth axis (x and z to be the same length). Actually they have the same min and max values, maybe I just need to set the axes to Automatic?Screen screen = Screen.FromControl(this);
Graphics g = Graphics.FromHwnd(this.Handle);
IntPtr hptr = g.GetHdc();
double xyscreen = GetDeviceCaps(hptr, HORZSIZE) * screen.Bounds.Height;
xyscreen /= (double)GetDeviceCaps(hptr, VERTSIZE) * screen.Bounds.Width;
Regards
jenb
Hi jenb,
1. Yes, you have to calculate xyscreen relation as you are doing. That's one of the differences in the process in VB6 and VS.
2. So, if I understand well, you would like to see the bottom and the depth axis with the same length in pixels. But it's necessary they have the same angle with the horizontal or not?
Best Regards,
| Yeray Alonso Development & Support Steema Software Av. Montilivi 33, 17003 Girona, Catalonia (SP) |
| |
Please read our Bug Fixing Policy |
Hi Yeray
I managed to get both axis equal by multiplying xyscreen by constant 1.7 (see below)
http://www.teechart.net/support/viewtopic.php?t=7885
I posted an example screen shot "Sn 552 Peak Energy Only.jpg" on your upload site. Does the drawThebox function in your solution in the above URL get over the "shrinking" problem. I found it quite hard to translate this function and I haven't included it so far in my code.
Regards
jenb
I managed to get both axis equal by multiplying xyscreen by constant 1.7 (see below)
I want both axis to look the same regardless of the rotation. I call the function in the OnMouseUp event and it works ok, but I have the problem of the chart "shrinking" as mentioned by the user in the example below.double xyscreen = GetDeviceCaps(hptr, HORZSIZE) * screen.Bounds.Height*1.7;
xyscreen /= (double)GetDeviceCaps(hptr, VERTSIZE) * screen.Bounds.Width;
http://www.teechart.net/support/viewtopic.php?t=7885
I posted an example screen shot "Sn 552 Peak Energy Only.jpg" on your upload site. Does the drawThebox function in your solution in the above URL get over the "shrinking" problem. I found it quite hard to translate this function and I haven't included it so far in my code.
Regards
jenb
Hi jenb,
Ok. Having a chart with an elevation like in the picture, I think I understand the meaning of rotating the chart. I'll try to make an example that will consider the elevation and the rotation in order to calculate and draw the isometric axis.
Regarding the shrinking problem, I think that this was due to rounding calculations but it was skipped by forcing the chart to be repainted one or maybe two times more.
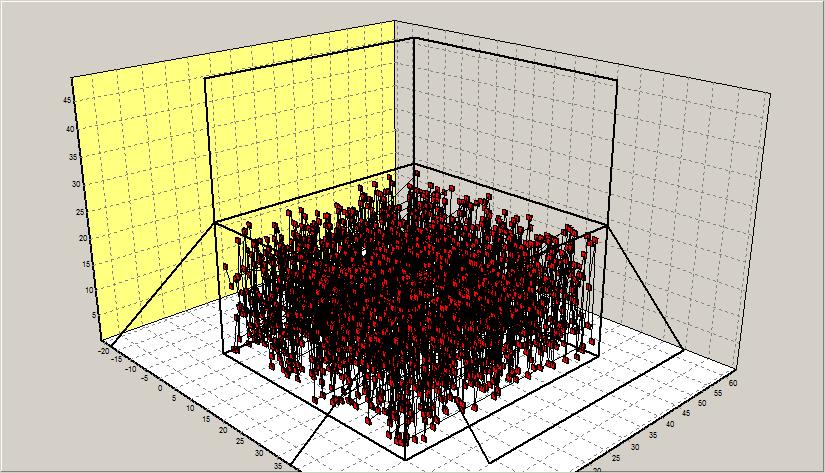
The drawTheBox method was very particular for this customer. He had 3D points in a box... The last code I posted there resulted in this:
Ok. Having a chart with an elevation like in the picture, I think I understand the meaning of rotating the chart. I'll try to make an example that will consider the elevation and the rotation in order to calculate and draw the isometric axis.
Regarding the shrinking problem, I think that this was due to rounding calculations but it was skipped by forcing the chart to be repainted one or maybe two times more.
The drawTheBox method was very particular for this customer. He had 3D points in a box... The last code I posted there resulted in this:
Best Regards,
| Yeray Alonso Development & Support Steema Software Av. Montilivi 33, 17003 Girona, Catalonia (SP) |
| |
Please read our Bug Fixing Policy |