
sorry about that. RzEdit.obj is a third party set of classes which add functionality to edits. the "Depth to Interpolate" is an RzNumericEdit. i did this because i wanted to force only numeric values in the field, and it was easier than trying to do all the OnChange handler events.
either i can replace this with a "standard" edit field, or you can.
Drawing a line between points
-
Narcís
- Site Admin

- Posts: 14730
- Joined: Mon Jun 09, 2003 4:00 am
- Location: Banyoles, Catalonia
- Contact:
Hi rperkins,
Thanks for the information. I finally managed to run your project here.
What I found is that the lines were plotted but erased by successive calls of Draw() method. I could get it working implementing the OnAfterDraw event like this:
Thanks for the information. I finally managed to run your project here.
What I found is that the lines were plotted but erased by successive calls of Draw() method. I could get it working implementing the OnAfterDraw event like this:
Code: Select all
void __fastcall TfrmPointPlot::Chart1AfterDraw(TObject *Sender)
{
  workChart->Canvas->Pen->Color = clBlack;

  for (int i=1; i<workSeries->Count(); i=i+2)
  {
    coord1X = workSeries->CalcXPos(i);
    coord1Y = workSeries->CalcYPos(i);
    coord2X = workSeries->CalcXPos(i-1);
    coord2Y = workSeries->CalcYPos(i-1);

    workChart->Canvas->Line(coord1X,coord1Y,coord2X,coord2Y);
  }
}
Best Regards,
| Narcís Calvet / Development & Support Steema Software Avinguda Montilivi 33, 17003 Girona, Catalonia Tel: 34 972 218 797 http://www.steema.com |
      |
| Instructions - How to post in this forum |
we're getting much closer.....
when i run the application with the update to the AfterDraw handler, and using the 98 & 100.2 pair & 100.00, i get the lines being drawn, as expected. running the application with the 22 & 24 pair & 23.00, i get the lines being drawn, but there are 2 that are associated with segments that aren't "real", and there are 2 segments that should be drawn, but aren't. stepping thru the debugger, i can see that all the segments are generated as expected, but the line draw code appears not take into account the non-continuousness of the line. that's why i was trying the code that was commented out in the AfterDraw handler ... i was hoping to be able to draw a single line based on the newly added "segment".
the reason that the first pair "works" is that i haven't finished the segment processing completely. that pair will generate an "upper" and "lower" part that is connected by a single line (hence the Q-Tip example in a previous part of the post). eventually, there will be parallel lines coming from the 2 points above 0,0 and going out to the edge (and the line along the edge between the 2 edge points won't exist).
did you try the 2nd set? the 22 & 24 pair? if you run that one, with 23.00 as the distance, you'll see what i mean.
-
Narcís
- Site Admin
- Posts: 14730
- Joined: Mon Jun 09, 2003 4:00 am
- Location: Banyoles, Catalonia
- Contact:
Hi rperkins,
Yes, I tried running both pairs and they all worked fine for me here. However, it's not clear to me what do you mean by setting 23.00 as the distance. I tried changing this line:
to
and
and got the same for all cases. Is this what I'm supposed to change? Please notice that I commented in line below as it didn't compile here.
Thanks in advance.
Yes, I tried running both pairs and they all worked fine for me here. However, it's not clear to me what do you mean by setting 23.00 as the distance. I tried changing this line:
Code: Select all
filename += "interp-";Code: Select all
filename += "interp-23";Code: Select all
filename += "interp-100";Code: Select all
filename += editInterpDepth->Text;Best Regards,
| Narcís Calvet / Development & Support Steema Software Avinguda Montilivi 33, 17003 Girona, Catalonia Tel: 34 972 218 797 http://www.steema.com |
| |
| Instructions - How to post in this forum |
note: LD=Less Dense File, MD=More Dense File.
no, when you run the application, you get a form. it's pre-set for LD=22, MD=24, and Distance=23.00. if you click on the LD button, pick the LD file that's at 100.22. click on the MD button and select the file thats at 98.12. enter 100.00 as the distance, then click the Process button.
also, i've got it drawing the segments. what i had to do was save off each of the segments that are passed in, and, in the AfterDraw handler, repeat the AddXY ( to get the point ID). then, from there, i use the Calc<X/Y>Pos functions, then do the Line function. still have a bit of cleanup, but will post a zip file with the souce. currently, it can only be run once, as i don't have the "hooks" in to reset the "save arrays". be just a few minutes, then, i'll post.
0941am - file has been posted - interp-101308.zip. not sure if this is the most optimal solution, but, i get the lines where they're supposed to be. will be updating the code to finish the "other" segment processing.
thanks!!!
-
Narcís
- Site Admin
- Posts: 14730
- Joined: Mon Jun 09, 2003 4:00 am
- Location: Banyoles, Catalonia
- Contact:
Hi rperkins,
Thanks for the information. Ok, I've added again an edit box for distance processing since I had removed the one you used and uncommented all the code that used it.
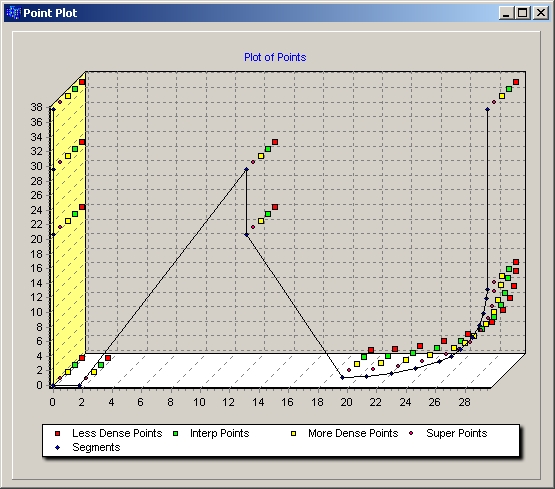
Using 22-24, distance=23 set I get this:
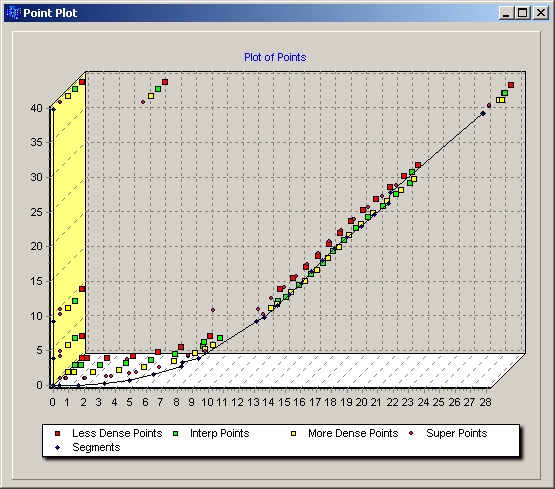
Using 98-100, distance=100 set I get this:
Is that what you get?
Thanks in advance.
Thanks for the information. Ok, I've added again an edit box for distance processing since I had removed the one you used and uncommented all the code that used it.
Using 22-24, distance=23 set I get this:
Using 98-100, distance=100 set I get this:
Is that what you get?
Thanks in advance.
Best Regards,
| Narcís Calvet / Development & Support Steema Software Avinguda Montilivi 33, 17003 Girona, Catalonia Tel: 34 972 218 797 http://www.steema.com |
| |
| Instructions - How to post in this forum |
yes, with the update you originally posted. try the "new" exe in the zip file from today. you'll see a box in the 22-24, 23 plot, instead of the zagged line.
remember, this is the profile of a ship, with the possibility of a "tunnel". also possible is a 2 segment ship (with parallel lines from the centerline).
are we having fun, yet? this has been quite a challenge, not only to develop the "behind the scenes" algorithms, but to get TChart to do something it may not have been designed to do.
-
Narcís
- Site Admin
- Posts: 14730
- Joined: Mon Jun 09, 2003 4:00 am
- Location: Banyoles, Catalonia
- Contact:
Hi rperkins,
Ok, thanks. Yes, now I get the box you mentioned. Sorry if I may not fully understand your request. What would you expect to be plotted in that chart then?
Thanks in advance.
Ok, thanks. Yes, now I get the box you mentioned. Sorry if I may not fully understand your request. What would you expect to be plotted in that chart then?
Thanks in advance.
Best Regards,
| Narcís Calvet / Development & Support Steema Software Avinguda Montilivi 33, 17003 Girona, Catalonia Tel: 34 972 218 797 http://www.steema.com |
| |
| Instructions - How to post in this forum |
based on the updated EXE (from today), i would expect what you're seeing - with an additional line or 2 along the top (which i haven't coded yet).
also, if you look at the 98-100.2 & 100.00 chart, you'll see 2 points above 0,0 and below 0,max height. my updates now are to create horizontal lines from x=0 to the 2 points along the perimeter. that'll make the 2 section view.
now that it's drawing the lines, if you can think of a more elegant way, let me know. also, feel free to post the PlotPoints code that you think would be relevant for someone else who is trying the same thing (there have been a lot of views of this post).