
I am adding Gantt bars with a start and end date that can span N number of months (not necessarily from the 1st to the end of the month).
I also have an array that has, for each month (e.g. Jan 2008):
1) A count of the number of elements / Gantt bars that exist for that month (as long as that month lies within the start & end date for the Gantt bar's date range)
2) Start Date - e.g. 1/1/2008
3) End Date - e.g. 1/31/2008
4) Month number - e.g. 1 (if first month is Jan 2008).
Currently, the bottom X axis shows the date values for whatever is visible (depending on zoom level). It's properties are set up using code like this:
TChart1.Scroll.Enable = pmBoth
TChart1.Zoom.Enable = False
TChart1.Axis.Bottom.SetMinMax MinStartDate, DateSerial(Year(MinStartDate), Month(MinStartDate), Day(MinStartDate) + Round((1.02 * MaxDaysInAnyPeriod), 0))
TChart1.Axis.Bottom.ExactDateTime = True
TChart1.Axis.Bottom.Increment = TChart1.GetDateTimeStep(dtOneMonth)
TChart1.Axis.Bottom.Labels.Angle = 0
TChart1.Axis.Bottom.Labels.DateTimeFormat = "yyyy/mm/dd"
How can I add a top / custom axis that will display the count for each month from the above array? Also, keep it in synch when the user zooms in / out ?
Gantt Chart - Count of number of items per month

Hi DjPete,
I think that you what you are trying to do it to have a top axis with custom labels. You can simply do:
Note that StartArray should be the array of the start positions of your gantts, or you could also do End-Start/2 to place the axis label in the middle of the gantts. And the ValueArray is the labels array you want to display, in your case the count of months.
I think that you what you are trying to do it to have a top axis with custom labels. You can simply do:
Code: Select all
TChart1.Axis.Top.Visible = True
TChart1.Series(0).HorizontalAxis = aBothHorizAxis

For i = 0 To 9
  TChart1.Axis.Top.Labels.Add StartArray(i), ValueArray(i)
Next iBest Regards,
 | Yeray Alonso Development & Support Steema Software Av. Montilivi 33, 17003 Girona, Catalonia (SP) |
      |
Please read our Bug Fixing Policy |
Thank you for the reply. I have developed a test application, and I have so far managed to get it to show me the following:
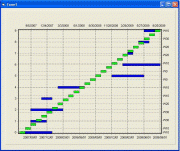
This is the code I have used:
-----------
Note: I have left out 'CalculateWCountPerPeriod', but it should be self-explanatory what it does.
What I want it to display is the values on the right Y axis (e.g. W10, W30 etc.) as values / labels on the top axis. This msut of course change dynamically when the user zooms in / out.
Then, then bars for Series(1) (from where the above values are obtained) need to be hidden.
So the idea is that Series(0) contains the dates for Gantt bars that must be displayed, and that Series(1) contains the count per period / month for the Gantt bars per month.
For example - you will notice that where the the value W30 (I have just multiplied 3 by 10 to make it stand out from the left Y axis values) is displayed for a green bar, that there are 3 blue bars that intersect that green bar's date range.
This is the code I have used:
Code: Select all
Option Explicit
Private Type DateList
  StartDate As String
  EndDate As String
  monthNo As Integer
  WCount As Integer
End Type

Private Type WList
  StartDate As String
  EndDate As String
End Type

Private arrW() As WList

Private globalArrDateList() As DateList
Private globalArrDateListIsEmpty As Boolean


Public Function GetLastDayOfMonth(pDate As Date)
    GetLastDayOfMonth = Day(DateSerial(Year(pDate), Month(pDate) + 1, 0))
End Function

Public Sub FillArray()
  arrW(0).StartDate = "7/1/2007 0:00"
  arrW(0).EndDate = "12/31/2007 23:59"

  arrW(1).StartDate = "9/1/2007 0:00"
  arrW(1).EndDate = "11/30/2007 23:59"

  arrW(2).StartDate = "9/1/2007 0:00"
  arrW(2).EndDate = "2/29/2008 23:59"

  arrW(3).StartDate = "11/1/2007 0:00"
  arrW(3).EndDate = "12/31/2007 23:59"

  arrW(4).StartDate = "2/1/2008 0:00"
  arrW(4).EndDate = "6/30/2008 23:59"

  arrW(5).StartDate = "3/1/2008 0:00"
  arrW(5).EndDate = "4/30/2008 23:59"

  arrW(5).StartDate = "11/1/2008 0:00"
  arrW(5).EndDate = "4/30/2009 23:59"

  arrW(5).StartDate = "12/1/2008 0:00"
  arrW(5).EndDate = "5/31/2009 23:59"

  arrW(6).StartDate = "2/1/2009 0:00"
  arrW(6).EndDate = "8/31/2009 23:59"

  arrW(7).StartDate = "3/1/2009 0:00"
  arrW(7).EndDate = "3/31/2009 23:59"

  arrW(8).StartDate = "5/1/2009 0:00"
  arrW(8).EndDate = "6/30/2009 23:59"

  arrW(9).StartDate = "6/1/2009 0:00"
  arrW(9).EndDate = "7/31/2009 23:59"
End Sub

Private Sub Form_Load()

  Dim mDate1 As String
  Dim mDate2 As String
  Dim dayLast

  Dim Y As Integer
  Dim count As Integer
  Dim BarColor As Long
  Dim BarColor2 As Long
  Dim index As Long

  Dim numVertaxis As Long
  Dim numHorizaxis As Long

  count = 10 'Specify how many combinations of StartDate and EndDates the array is filled with.

  ReDim arrW(count - 1) As WList

  FillArray

  'Insert the start and end date for each month for the number of periods
  'specified above into the array, and also determine the WCount
  CalculateWCountPerPeriod

  TChart1.AddSeries scGantt
  TChart1.AddSeries scGantt

  TChart1.Series(0).asGantt.StartValues.Order = loNone
  TChart1.Series(1).asGantt.StartValues.Order = loNone

  With TChart1
    .Series(0).asGantt.ConnectingPen.Visible = False
    .Axis.Bottom.ExactDateTime = True
    .Axis.Bottom.Increment = TChart1.GetDateTimeStep(dtOneMonth)
    .Axis.Bottom.Labels.Angle = 0
    .Axis.Bottom.Labels.DateTimeFormat = "yyyy/mm/dd"

    BarColor = vbBlue
    BarColor2 = vbBlue

    .Axis.Top.Visible = True

    With TChart1.Axis
      numVertaxis = .AddCustom(False)
      numHorizaxis = .AddCustom(True)

      With .Custom(numVertaxis)
        .ExactDateTime = True
        .Increment = TChart1.GetDateTimeStep(dtOneMonth)
        .Labels.Angle = 0
        .Labels.DateTimeFormat = "dd/mm/yyyy"
        .Otherside = True
      End With

      With .Custom(numHorizaxis)
        .ExactDateTime = True
        .Increment = TChart1.GetDateTimeStep(dtOneMonth)
        .Labels.Angle = 0
        .Labels.DateTimeFormat = "yyyy/mm/dd"
        .Otherside = True
      End With

      TChart1.Series(1).VerticalAxisCustom = numVertaxis
      TChart1.Series(1).HorizontalAxisCustom = numHorizaxis
      TChart1.Series(1).HorizontalAxis = aTopAxis
    End With

    For Y = 0 To UBound(arrW)
      index = _
      .Series(0).asGantt.AddGanttColor(DateValue(arrW(Y).StartDate) _
                                       + TimeValue(arrW(Y).StartDate), _
                                       DateValue(arrW(Y).EndDate) _
                                       + TimeValue(arrW(Y).EndDate), _
                                       Y, _
                                       CStr(Y), _
                                       BarColor)
    Next Y

    For Y = 0 To UBound(globalArrDateList)
      index = .Series(1).asGantt.AddGanttColor(DateValue(globalArrDateList(Y).StartDate) _
                                       + TimeValue(globalArrDateList(Y).StartDate), _
                                       DateValue(globalArrDateList(Y).EndDate) _
                                       + TimeValue(globalArrDateList(Y).EndDate), _
                                       Y - 0.5, _
                                       "W" & CStr(globalArrDateList(Y).WCount), _
                                       vbGreen)

      TChart1.Axis.Custom(numHorizaxis).Labels.Add index, CStr(globalArrDateList(Y).WCount)
    Next Y

  TChart1.Axis.Custom(numHorizaxis).Labels.Clear

  End With
End Sub
Note: I have left out 'CalculateWCountPerPeriod', but it should be self-explanatory what it does.
What I want it to display is the values on the right Y axis (e.g. W10, W30 etc.) as values / labels on the top axis. This msut of course change dynamically when the user zooms in / out.
Then, then bars for Series(1) (from where the above values are obtained) need to be hidden.
So the idea is that Series(0) contains the dates for Gantt bars that must be displayed, and that Series(1) contains the count per period / month for the Gantt bars per month.
For example - you will notice that where the the value W30 (I have just multiplied 3 by 10 to make it stand out from the left Y axis values) is displayed for a green bar, that there are 3 blue bars that intersect that green bar's date range.
Ok, I made a bit more progress - I added the following code:
Now the labels on the right-hand Y axis are repeated on the top axis (instead of the dates being shown).
Now I just need to hide the right axis labels and the green bars...
Code: Select all
.Axis.Top.Labels.Style = talTextNow I just need to hide the right axis labels and the green bars...
Hiding the right-hand Y axis labels is accomplised with:
So hiding the green bars is next...
Code: Select all
TChart1.Axis.Custom(numVertAxis).Visible = FalseHiding the green bars can be accomplished by:

Any suggestions on how to improve this code?
Code: Select all
TChart1.Series(1).asGantt.Pointer.Visible = FalseAny suggestions on how to improve this code?
Hi DjPete,
To hide your series, you could also do as follows:
To hide your series, you could also do as follows:
Code: Select all
TChart1.Series(1).asGantt.Pointer.Style = psNothingBest Regards,
| Yeray Alonso Development & Support Steema Software Av. Montilivi 33, 17003 Girona, Catalonia (SP) |
| |
Please read our Bug Fixing Policy |