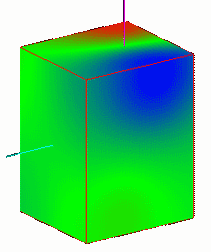
Hello, I'm working on a project and I try tu use Teechart AX V8. The project is to simulate the gradients of temperature in an oven, we have 9 temperature probes, one in each corner an the last one in the middle. We would like to show the gradients of temperature in the oven, probably with a 3D function.
I stay stuck on this feature, every ideas about this application will be welcome.
Thanks
JP
Temperature gradients ?
-
Narcís
- Site Admin

- Posts: 14730
- Joined: Mon Jun 09, 2003 4:00 am
- Location: Banyoles, Catalonia
- Contact:
Hi JP,
Yes, you could try using ColorGrid or Surface series for representing that. You'll find examples of such series at All Features\Welcome!\Extended\Surface and All Features\Welcome!\Statistical\ColorGrid in the features demo available at TeeChart's program group. Here you'll find information on how those series styles work.
Also notice that we are currently working on implementing new Gauges for the next TeeChart Pro v8 ActiveX maintenance release. Such gauges are already available for latest VCL and .NET versions.
Best Regards,
| Narcís Calvet / Development & Support Steema Software Avinguda Montilivi 33, 17003 Girona, Catalonia Tel: 34 972 218 797 http://www.steema.com |
      |
| Instructions - How to post in this forum |
Hello, I'll be glad to use the new gauges for my industrial applications.
I'm sorry but I tried out a lot of solution with surface and color but I didn't get what I need.
You can see below what I expect... we have only 9 measures, one for each corner and one for the middle of the room.

Every help is welcome.
Thanks,
JP
I'm sorry but I tried out a lot of solution with surface and color but I didn't get what I need.
You can see below what I expect... we have only 9 measures, one for each corner and one for the middle of the room.

Every help is welcome.
Thanks,
JP
Hello, I add some more information, there is any answer...
Of course we can calculate interpolated values between the points. In fact, at the end we can get an array of values like that:
Position X, Position Y, Position Z, Value ...etc
The value must condition the color, high = dark red, low= dark blue..and the intermediate values must bring an intermediate color ... The concept is easy but how the support it in TeeChart ? with a 3D volume ....
If somebody is interested with that "job"... please contact me
Thanks
JP
-
Narcís
- Site Admin

- Posts: 14730
- Joined: Mon Jun 09, 2003 4:00 am
- Location: Banyoles, Catalonia
- Contact:
Hi Aligator,
You can achieve something similar to what you request drawing a point cloud using Point3D series. You can change the point density playing with the CubeSize and pointer's HorizontalSize and VerticalSize. Another interesting parameter here is the pointer transparency. Here's an example of what I commented:
Hope this helps!
You can achieve something similar to what you request drawing a point cloud using Point3D series. You can change the point density playing with the CubeSize and pointer's HorizontalSize and VerticalSize. Another interesting parameter here is the pointer transparency. Here's an example of what I commented:
Code: Select all
Option Explicit

Private Sub Form_Load()
    Dim Increment As Double
    Dim CubeSize As Integer
    Dim X, Y, Z As Double

    TeeCommander1.Chart = TChart1
    TChart1.Aspect.Chart3DPercent = 100

    TChart1.AddSeries scPoint3D
    TChart1.Series(0).asPoint3D.Pointer.Pen.Visible = False
    TChart1.Series(0).asPoint3D.Pointer.VerticalSize = 2
    TChart1.Series(0).asPoint3D.Pointer.HorizontalSize = 2
    TChart1.Series(0).asPoint3D.Pointer.Transparency = 50
    TChart1.Series(0).asPoint3D.LinePen.Visible = False

    CubeSize = 30

    For X = 0 To CubeSize
        For Z = 0 To CubeSize
            For Y = 0 To CubeSize
                TChart1.Series(0).asPoint3D.AddXYZ X, Y, Z, "", RGB(GetTemperature, GetTemperature, GetTemperature)
            Next Y
        Next Z
    Next X

End Sub

Function GetTemperature() As Integer
    Dim UpperBound, LowerBound As Integer
    Randomize

    UpperBound = 255
    LowerBound = 0

    GetTemperature = Int((UpperBound - LowerBound + 1) * Rnd + LowerBound)
End FunctionBest Regards,
| Narcís Calvet / Development & Support Steema Software Avinguda Montilivi 33, 17003 Girona, Catalonia Tel: 34 972 218 797 http://www.steema.com |
      |
| Instructions - How to post in this forum |

