Page 1 of 1

It is impossible to draw. Advise

Posted: Mon Apr 20, 2009 10:58 am
by 10552878
Hello

At me it is impossible to draw standard methods here so:

ImageImage


TSeriesBandTool certainly can help me with it, but I do not know as.

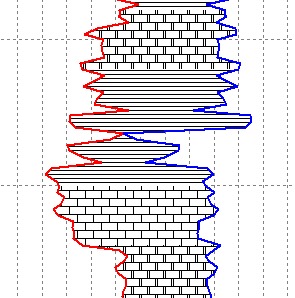
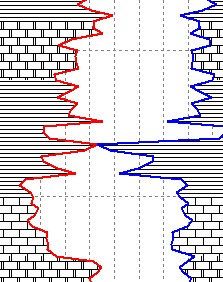
Has put still that images are loaded from a database and become attached to axis Y. Such image is used for display of a cut of a chink in geophysics and geology.

I so understand for this purpose it is necessary to create
Series1: = THorizLineSeries.create,
Then as that to connect with TSeriesBandTool.
At the moment before drawing TSeriesBandTool, it is necessary to draw again TSeriesBandTool. Brush. Image.
If it is necessary to connect
TSeriesBandTool.series: = Serie2
And
TSeriesBandTool.series2: = Serie3;

Or in general manually to draw on points in event AfterDrawValues or BeforeDrawValues depending on property DrawBehindSeries, which else it is necessary somewhere and as that to store.

There is one more problem. Sometimes it is necessary to carry out pouring of areas between two Series on a condition. If value series1> series2, one colour, differently another. Even worse when it is necessary to display a gradient, in dependence in what range there are 2 Series and on the cook they distance from each other. The given methods of representation of the information are applied in geophysics.

In advance thanks.

Posted: Tue Apr 21, 2009 3:55 pm
by yeray
Hi BoikovSoft,

The best solution we can think for now would be using 2 series and a SeriesBand tool for each interval. Then you could set a different brush or pattern in each one of the tools. Here is an example:

Note that doing in this way, we have to connect the intervals having repeated values. I mean that the last value of a line must be also the first in the following line in order to be connected.

Code: Select all

uses series, TeeSeriesBandTool, Math;

procedure TForm1.FormCreate(Sender: TObject);
var i, j: Integer;
x, y: Double;
begin
  Chart1.View3D := False;
  Chart1.Legend.Visible := False;

  y := 0;

  for i:=0 to 4 do
  begin
    Chart1.Tools.Add(TSeriesBandTool.Create(nil));
    Chart1.AddSeries(THorizLineSeries.Create(nil));
    Chart1.AddSeries(THorizLineSeries.Create(nil));
    Chart1[i*2].Pen.Width := 2;
    Chart1[i*2+1].Pen.Width := 2;
    (Chart1.Tools[i] as TSeriesBandTool).Series := Chart1[i*2];
    (Chart1.Tools[i] as TSeriesBandTool).Series2 := Chart1[i*2+1];


    (Chart1.Tools[i] as TSeriesBandTool).Brush.Style := TBrushStyle(i+2);

    if i>0 then // add the last point of the precedent series at the begining of the next one to connect the lines
    begin
      y := y-1;
      x := Chart1[i*2-2].XValue[Chart1[i*2-2].Count-1];
      Chart1[i*2].AddXY(x, y, '', clRed);
      x := Chart1[i*2-1].XValue[Chart1[i*2-1].Count-1];
      Chart1[i*2+1].AddXY(x, y, '', clBlue);
      y := y+1;
    end;

    for j:=0 to 9 do
    begin
      x := Random*10+10;
      Chart1[i*2].AddXY(x, y, '', clRed);
      x := random*10+20;
      Chart1[i*2+1].AddXY(x, y, '', clBlue);
      y := y+1;
    end;
  end;

  Chart1.Axes.Bottom.SetMinMax(0,40);
end;

Posted: Wed Apr 22, 2009 12:07 pm
by 10552878
Hi Yeray,

Fairly to admit you have found the unexpected decision for me. In rather original way. Respect :!:

But such way is not comprehensible to me. It will cause weight of problems and a heap of an unnecessary code.

Looking at your decision I have thought up the, I suggest to familiarise, can you apply it at myself:

Code: Select all

procedure TForm1.BitBtn2Click(Sender: TObject);
Var
  j : Integer;
  x, y : Double;
begin
  Chart1.View3D := False;
  Chart1.Legend.Visible := False;
  y := 0;
  Chart1.Tools.Add(TSeriesBandTool.Create(nil));
  Chart1.AddSeries(THorizLineSeries.Create(nil));
  Chart1.AddSeries(THorizLineSeries.Create(nil));
  Chart1.AddSeries(THorizLineSeries.Create(nil));
  (Chart1.Tools[0] as TSeriesBandTool).Series := Chart1[0];
  (Chart1.Tools[0] as TSeriesBandTool).Series2 := Chart1[1];
  Chart1[2].Pen.Visible := false;
  Chart1.LeftAxis.SetMinMax(0,20);
  for j:=0 to 9 do
  begin
    x := Random * 10 + 10;
    Chart1[0].AddXY(x, y, '', clRed);
    x := random * 10 + 20;
    Chart1[1].AddXY(x, y, '', clBlue);
    Chart1[2].AddXY(j,y);
    y := y + 1;
  end;
end;

procedure TForm1.MyDraw(Sender: TObject);
Var
  j, OldHeigth : Integer;
  B, B2 : TBitMap;
  Ser : THorizLineSeries;
begin
    Ser := THorizLineSeries(Sender);
    B := TBitMap.Create;
    try
      B.Width := 10;
      b.Height := EnsureRange(Ser.CalcYPos(0), 0, Ser.ParentChart.Height);
      for j := 1 to Ser.Count-1  do
      begin
            B2 := TBitMap.Create;
            try
              b2.Width := B.Width;
              b2.Height := EnsureRange(Ser.CalcYPos(j), 0, Ser.ParentChart.Height)
                - EnsureRange(Ser.CalcYPos(j - 1), 0, Ser.ParentChart.Height);
              {Here it is possible to draw anything you like according to values Series.}
              b2.Canvas.Brush.Color:=Round(Ser.XValues[j])*1000;
              b2.Canvas.FillRect(Rect(0, 0, b2.Width, b2.Height));

              OldHeigth := b.Height;
              b.Height := b.Height + b2.Height;
              b.Canvas.Draw(0, OldHeigth, b2);
            Finally
              B2.Free;
            end;
      end;
      (Chart1.Tools[0] as TSeriesBandTool).Brush.Image.Assign(b);
    finally
      b.Free;
    end;
end;

procedure TForm1.Chart1BeforeDrawSeries(Sender: TObject);
begin
  {In event Series. BeforeDrawValue on normal it is impossible 
    to draw, therefore to have to use event Chart1.OnBeforeDrawSeries}
  if Chart1.SeriesCount = 3 then
    MyDraw(Chart1[2]);
end;

Best Regards

Posted: Wed Apr 22, 2009 2:22 pm
by yeray
Hi BoikovSoft,

We've seen your code but we can't understand what are you trying to achieve. We don't understand why you use the method EnsureRange, nor the purpose of the 3rd (hidden) series. Is it used only to calculate a different color for each bitmap?

Note that in order to run your code, we had to change this:

Code: Select all

b2.Height := EnsureRange(Ser.CalcYPos(j), 0, Ser.ParentChart.Height)
                - EnsureRange(Ser.CalcYPos(j - 1), 0, Ser.ParentChart.Height);
for this, in order to have positive b2.Height:

Code: Select all

b2.Height := EnsureRange(Ser.CalcYPos(j - 1), 0, Ser.ParentChart.Height)
                - EnsureRange(Ser.CalcYPos(j), 0, Ser.ParentChart.Height);
Finally, we haven't been able to see any of the bitmaps drawn.

Posted: Fri Apr 24, 2009 8:42 am
by 10552878
Hi Yeray,
Method EnsureRange is necessary for restriction of height TBitMap. The matter is that TBitMap. Height> = 0. And she cannot be negative. And then, what for to us to Draw there where all the same it is not visible? Therefore I have made check of Value with restrictions

Code: Select all

EnsureRange (B.Heigth, 0, Chart1.Heigth);
If B.Heigth <0 the result of function will be 0.
If b. Heigth> Chart1.Heigth the result of function will be Chart1.Heigth,
If 0 <= b. Heigth <=Chart1.Heigth the result of function will be b. Heigth.

Apropos? :

Code: Select all

b2.Height: = EnsureRange (Ser. CalcYPos (j), 0, Ser. ParentChart. Height) 
                 - EnsureRange (Ser. CalcYPos (j - 1), 0, Ser. ParentChart. Height);
I at first at all have not understood why you have asked it, yet has not created Chart dynamically.
I have forgotten, that I have made preliminary options TChart, namely Chart1.LeftAxis. Inverted: = true;
Now, that the previous expression became more correct, it is necessary to take this expression on the module:

Code: Select all

b2.Height: = ABS (EnsureRange (Ser. CalcYPos (j - 1), 0, Ser. ParentChart. Height)
                 - EnsureRange (Ser. CalcYPos (j), 0, Ser. ParentChart. Height));
The given expression protects from error occurrence at use of methods Zoom.

What for I have created third Series?

In Series3 it is brought data adhered to axis Y, and in X the code of a picture from the directory is brought for example, or we use value Labels.
For example

Code: Select all

Series3.Addxy (1,1, ' C:\Limestone.bmp ');
Series3.Addxy (2,2, ' C:\Dolomite.bmp ');
Series3.Addxy (3,1, ' C:\Limestone.bmp ');
Series3.Addxy (10,3, ' C:\Clay.bmp ');
When I wrote the following code:

Code: Select all

b2.Canvas. Brush. Color: = Round (Ser. XValues [j]) *1000;
b2.Canvas. FillRect (Rect (0, 0, b2.Width, b2.Height));
I wished to show only idea which has come to to me mind for the decision of the given problem.

Why I have hidden Series. Pen. Visible: = false?

To display her on the screen it is not necessary. She serves only as the container for storage of the adhered information. This line is convenient for using at position calculations on axis Y or X.

That all has risen on the places, I suggest to look the corrected variant:

Code: Select all

procedure TForm1.BitBtn1Click (Sender: TObject);
Var
  j: Integer;
  x, y: Double;
begin
  MYChart: = TChart. Create (Self);
  MYChart. Parent: = Self;
  MYChart. OnBeforeDrawSeries: = Chart1BeforeDrawSeries;
  MYChart. View3D: = False;
  MYChart. LeftAxis. Inverted: = true;
  MYChart. Legend. Visible: = False;
  y: = 0;
  MYChart. Tools. Add (TSeriesBandTool. Create (nil));
  MYChart. AddSeries (THorizLineSeries. Create (nil));
  MYChart. AddSeries (THorizLineSeries. Create (nil));
  MYChart. AddSeries (THorizLineSeries. Create (nil));
  (MYChart. Tools [0] as TSeriesBandTool).Series: = MYChart [0];
  (MYChart. Tools [0] as TSeriesBandTool).Series2: = MYChart [1];
  MYChart [2].Pen. Visible: = false;
  MYChart. LeftAxis. SetMinMax (0,20);
  for j: = 0 to 9 do
  begin
    x: = Random * 10 + 10;
    MYChart [0].AddXY (x, y, ", clRed);
    x: = random * 10 + 20;
    MYChart [1].AddXY (x, y, ", clBlue);
    MYChart [2].AddXY (j, y);
    y: = y + 1;
  end;
end;

procedure TForm1.MyDraw (Sender: TObject);
Var
  j, OldHeigth: Integer;
  B, B2: TBitMap;
  Ser: THorizLineSeries;
begin
    Ser: = THorizLineSeries (Sender);
    B: = TBitMap. Create;
    try
      B.Width: = 10;
      b. Height: = EnsureRange (Ser. CalcYPos (0), 0, Ser. ParentChart. Height);
      for j: = 1 to Ser. Count-1 do
      begin
            B2: = TBitMap. Create;
            try
              b2.Width: = B.Width;
              //b2.Height: = ABS (Ser. CalcYPos (j - 1) - Ser. CalcYPos (j))
              {Metod EnsureRange}
              b2.Height: = ABS (EnsureRange (Ser. CalcYPos (j - 1), 0, Ser. ParentChart. Height)
                - EnsureRange (Ser. CalcYPos (j), 0, Ser. ParentChart. Height));
              {Here it is possible to make anything you like.}
              b2.Canvas. Brush. Color: = Round (Ser. XValues [j]) *1000;
              b2.Canvas. FillRect (Rect (0, 0, b2.Width, b2.Height));

              OldHeigth: = b. Height;
              b. Height: = b. Height + b2.Height;
              b. Canvas. Draw (0, OldHeigth, b2);
            Finally
              B2.Free;
            end;
      end;
      (MYChart. Tools [0] as TSeriesBandTool).Brush. Image. Assign (b);
    finally
      b. Free;
    end;
end;

procedure TForm1.Chart1BeforeDrawSeries (Sender: TObject);
begin
  if MYChart. SeriesCount = 3 then
    MyDraw (MYChart [2]);
end;

Posted: Fri Apr 24, 2009 11:37 am
by yeray
Hi BoikovSoft,

Thank you very much for your code, it could be helpful for other customers with similar problems. The result looks quite nice.

I only can suggest you to deactivate your dummy series if you won't draw it:

Code: Select all

MYChart[2].Active := false;
And, could you please tell us what IDE are you programming with? Just curiosity.

Posted: Fri Apr 24, 2009 12:32 pm
by 10552878
I use
Delphi 7.0 Enterprise
TeeChart Professional v8.04 VCL with source code Single Licence
I only can suggest you to deactivate your dummy series if you won't draw it:

Code: Select all

MYChart[2].Active := false;
It is guilty. Has absolutely forgotten about this property.
You are certainly right.

There is a joke about my memory in a head:

"Two mbytes is not memory, it is a sclerosis"

I at first try, then the help I read. :))))

Certainly there is actual a question with property Stairs. Wished to correct itself in source codes
procedure TSeriesBandTool. DrawBandTool;
But suddenly there was a laziness. :))

Posted: Fri Apr 24, 2009 2:22 pm
by yeray
Hi BoikovSoft,
Yeray wrote:And, could you please tell us what IDE are you programming with? Just curiosity.
BoikovSoft wrote:Delphi 7.0 Enterprise
It's only that my delphi 7 doesn't understand the symbol ':=' with a space in the middle. This doesn't compile:

Code: Select all

MYChart : = TChart.Create(Self);
BoikovSoft wrote:Certainly there is actual a question with property Stairs. Wished to correct itself in source codes procedure TSeriesBandTool. DrawBandTool;
But suddenly there was a laziness. Smile)
Yes, it's a known bug (TV52013891) we will try to fix. But it's not laziness, it's the cost/benefit relation. I mean, we have more critical bugs in the list that should be fixed before but we won't forget it.

Posted: Mon Apr 27, 2009 3:21 am
by 10552878
Simply so it was inserted. I specially so did not make.
I use the program translator PROMT 8.0. Here it also has made so ": ="