Page 1 of 2

Smooth 3-D pie charts, ala Rube Goldberg

Posted: Tue Nov 18, 2008 8:49 pm
by 9337917
Folks,

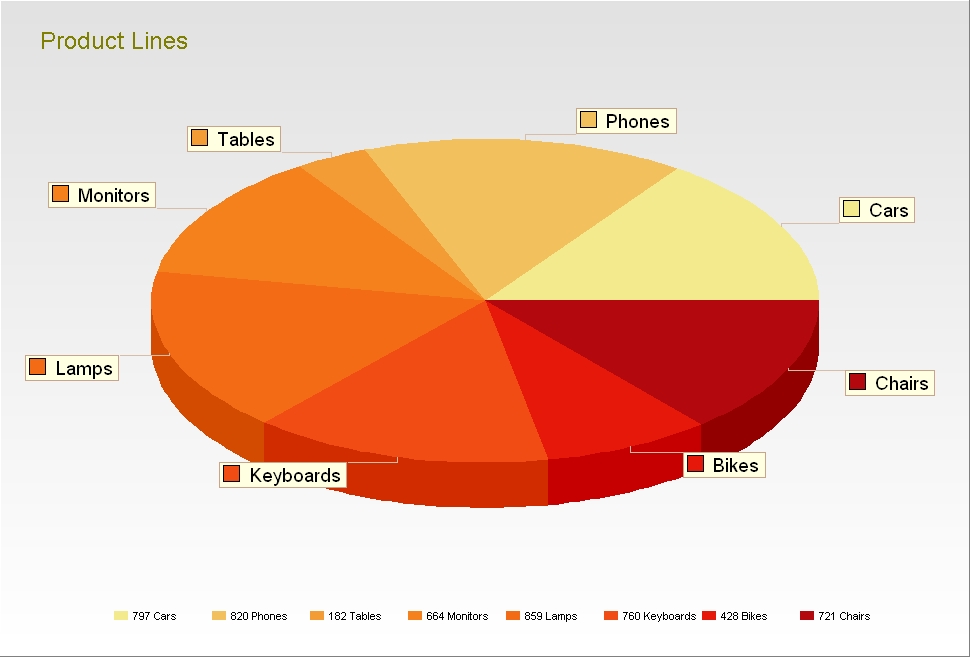
The goal is a smoothly-rounded 3D pie chart. One with sharp clear text.

I then take that chart, and save it to file using either SaveToBitmapFile or SaveToMetafileEnh. Lastly, that graphic file gets inserted into my document (I use the fabulous WPTools).

Most approaches I've seen out there, including your own (be it SmoothStetch, StretchDraw, various Antialias schemes) *do* help smoothen out the jaggies of the pie chart's outer edge, and slice lines. Some do a better job than others.

But the price paid for that is blurry, non-sharp text. The slice labels, legend item text, chart headers, etc, all of them, fuzzy. The more effective the jaggie smoothing, the more affected the text, losing its sharpness.

And that's the problem, blurring of text, that I'm trying to address: combine a smoothed-out 3D pie chart with crisp, clear, text, in effect, a two-step pie chart production:

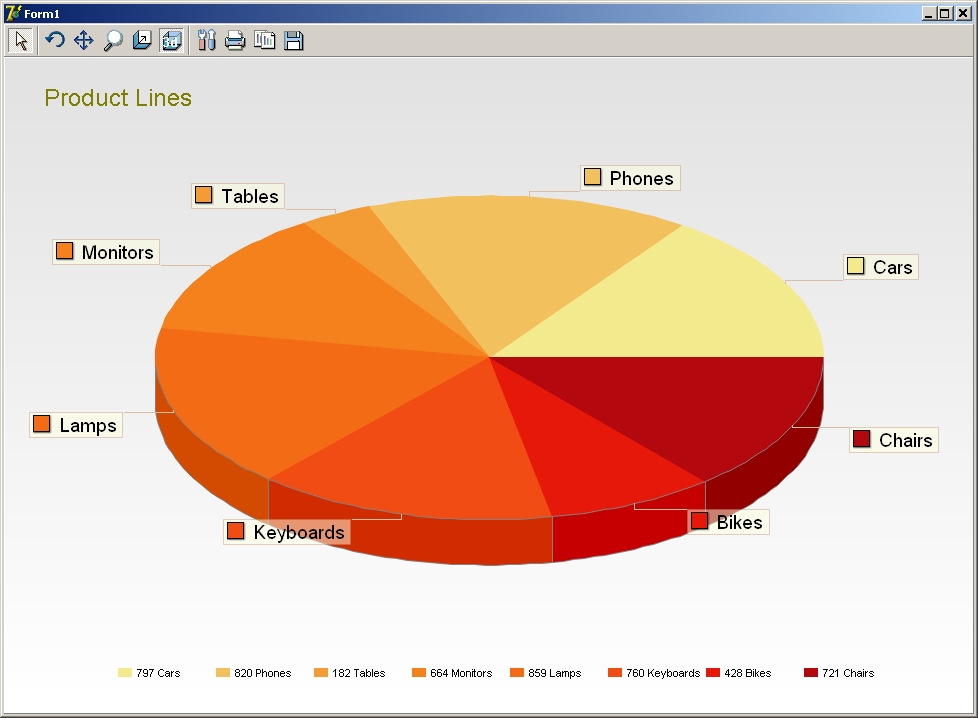
1) the chart without text, which is then antialiased or smoothed out, then
2) add text on top of that

So how can I produce a 3D pie chart with no text (no labels, no title, footer, legends, etc), by for instance setting their Visible properties False, and, here's the main question, have that pie chart be the SAME SIZE size as though the labels, legends, title, etc WERE there, and Visible?

If I could do that, I'd then try something like:

1) SaveToMetaFileEnh,
2) do some processing of the bitmap, smoothing out the jaggies of the bitmap, rounding the chart. That I can already do
3) bring the bitmap back to the canvas (via Chart1.Canvas.Draw ( 0, 0, savedImagesBitmap)),
4) draw the various text elements on top of that just drawn-on canvas.

As a somewhat related question, how can I retrieve the X and Y radius of a pie chart, or some other Chart property involving just the PIE chart's actual height and width (not Chart1.Width and Chart1.Height) after it's been drawn? I was hoping CustomXRadius and CustomYRadius would be set to a non-zero value after the chart's drawn, but that's not the case.

Okay, so I ramble. Shoot me...;) Lots of coffee today!

Thanks in advance..:)
Regards,
richard diamond

(TeeChart V 7.12)

Posted: Wed Nov 19, 2008 8:45 am
by narcis
Hi richard,
So how can I produce a 3D pie chart with no text (no labels, no title, footer, legends, etc), by for instance setting their Visible properties False, and, here's the main question, have that pie chart be the SAME SIZE size as though the labels, legends, title, etc WERE there, and Visible?

If I could do that, I'd then try something like:

1) SaveToMetaFileEnh,
2) do some processing of the bitmap, smoothing out the jaggies of the bitmap, rounding the chart. That I can already do
3) bring the bitmap back to the canvas (via Chart1.Canvas.Draw ( 0, 0, savedImagesBitmap)),
4) draw the various text elements on top of that just drawn-on canvas.
That sounds a little bit tricky to me. As you said, as a Rube Goldberg machine :wink:.

We have enhanced pie series in TeeChart v8. You can get something like this:

Image

In v8 we also added AntiAlias tool which converts the image above to this:

Image

Is that similar to what you are trying to achive? If you are interested I can send you v8's project for creating pies above.

We are also working on a new OpenGL rendering engine for next TeeChart version. It will provide superior rendering quality and advanced features.
As a somewhat related question, how can I retrieve the X and Y radius of a pie chart, or some other Chart property involving just the PIE chart's actual height and width (not Chart1.Width and Chart1.Height) after it's been drawn? I was hoping CustomXRadius and CustomYRadius would be set to a non-zero value after the chart's drawn, but that's not the case.
Code below using XRadius and YRadius gives the dimensions you are looking for.

Code: Select all

procedure TForm1.FormCreate(Sender: TObject);
begin
  Series1.FillSampleValues();
  Chart1.Draw;
end;

procedure TForm1.Chart1AfterDraw(Sender: TObject);
begin
  Chart1.Title.Text.Add(IntToStr(Series1.XRadius));
  Chart1.Title.Text.Add(IntToStr(Series1.YRadius));
end;
Hope this helps!

Posted: Wed Nov 19, 2008 4:22 pm
by 9337917
Narcís,

Thank you very much for your gracious offer of the V8 project. I would like to see it! Yes, you understood perfectly what I was after.

On screen? The stuff you show here looks SWEET. It's exciting, everything I wanted. Smoother 3-D charts, with crisp fonts.

The issue, however, in my real world, is what the image looks like when saved to bitmap or emf. Is that smooth, or is bumpiness seen in the image?

Narcís, I have copies of emails to Marjan going back to 2002, titled things such as "3D pie charts and smooth rendering" where I ask about the issue. In another, the subject was "3D pie charts, smooth rendering, and anti-aliasing". In one , Marjan replied:

"Yes, some crucial improvements. But the final goal of using bsplines for this is still not implemented. When you do a projection on plane, you cannot simply use the splines and get correct results. Now pies are a lot smoother, also because now you can use anti-aliasing to make them look nicer."

So as you can see, this one goes back some time!

If, using V8, the anti-aliased image when saved off to file looks clean (our typical charts have a radius of 1.5 to 2 inches), I'd be HAPPY to upgrade right NOW!!

Wanting to send you more money,
richard diamond

Posted: Wed Nov 19, 2008 4:41 pm
by narcis
Hi richard,

We'll need to investigate a little bit here but so far I haven't found an exporting method that produces a chart like in the second image I posted. For producing it I had to do Alt + Print Screen, paste image to an image processing tool and save it as JPEG.

Also I think some improvements have been done in pie series recently.

We will get back to you when we have further information. Anyway, I'll send you the project so that you can have a look at it.

Posted: Wed Nov 19, 2008 5:21 pm
by 9337917
Narcís,

Thank you SO much for your responsiveness to all this.

Okay, so while David et al give this some thought, question.

CAN I produce a chart without text, export it, then add all text elements after the fact?

I have a process that smooths the exported 3-D pie chart itself rather nicely. I use the Graphics32 package, resampling with the TLanczosKernel. It's quite similar to the approach used in TeeChart to do its smoothing.

So what's the PROBLEM??? The text. If it's in the exported image that I process, gets blurry, to the point of not being acceptable.

And the sad saga continues....:((

Regards,
richard diamond

Posted: Wed Nov 19, 2008 6:05 pm
by narcis
Hi richard,

Doing something like this would help?

Code: Select all

procedure TForm1.FormCreate(Sender: TObject);
var XRadius, YRadius: Integer;
begin
  Series1.FillSampleValues();

  Chart1.Draw;

  XRadius:=Series1.XRadius;
  YRadius:=Series1.YRadius;

  //Export chart *with* text here

  Series1.Marks.Visible:=false;
  Series1.CustomXRadius:=XRadius;
  Series1.CustomYRadius:=YRadius;

  Chart1.Draw;

  //Export chart *without* text here
end;

Posted: Wed Nov 19, 2008 6:44 pm
by 9337917
Narcís,

I think so, yes! Now, important question (and I hope lots of folks are reading this thread with great interest).

After I have an exported text-less chart, and smooth it out, if I then do something along the lines of

Code: Select all

var
  bmSmoothed : bitmap;
begin

  Chart1.SaveToBitMapFile( 'C:\TextLessExport.bmp' );

  bmSmoothed := TBitMap.Create;
  try
    bmSmoothed.LoadFromFile( 'C:\TextLessExport.bmp' );
    Chart1.Canvas.Draw( 0, 0, bmSmoothed);
  finally
    FreeAndNil( bmSmoothed );
  end;
end;
can I then set the marks (and legends, titles, etc.) Visible again, do another Chart1.Draw, and the chart ITSELF will be the smoothed image, or will the chart itself be regenerated as well, in effect overwriting the smoothed image I imported back in???

We're getting close, I think!!!

Scrambling like hell 'cause I bet it's getting close to the end of your day,
richard diamond

Posted: Fri Nov 21, 2008 2:56 pm
by 9337917
Narcís,

Could you please give me some guidance about the Canvas.Draw question in my prior post?

I feel I'm close to solving this IF I can do the following, as described in that post: use the Chart1.Canvas.Draw method to draw my now smoothed-out image onto the Canvas, then set the text elements visible, and do another Chart1.Draw / [ export ], can I somehow do that last Draw so ONLY the text elements are rendered, leaving the image (the smoothed Chart), I brought in intact, rather than also redrawing the Chart itself, effectively over-writing the Chart image I brought in?

Thanks..:))
richard diamond

Posted: Fri Nov 21, 2008 3:25 pm
by narcis
Hi richard,

Sorry for the delayed reply. I haven't forgotten about this one but we need to do some investigation on this field to be able to give you an answer.

Posted: Fri Nov 21, 2008 3:28 pm
by 9337917
Narcís,

Don't ya just hate pushy impatient nagging users? Dang... LOL! Sometimes I feel like Verucka Salt in Willie Wonka. "I want it, and I want it NOW, Daddy!!!"

Excellent to better news. Thank you SO much. I know I'm in good hands..:)))

Appreciative regards,
richard diamond

Posted: Wed Nov 26, 2008 12:34 pm
by narcis
Hi richard,

No problem. I understand that each customer issues are the most important ones for them :wink:.

However, this is not an easy one and Pep and I had to do some brainstorming and tests with the pie project I sent you.

We didn't get satisfactory results using the approach you suggested even there could be some more ideas left we could still try. However, it came to our mind that using GDI+ would probably be the easiest solution here. TeeGDIPlus canvas offers the option to separately set antialias for the chart and for the text, for example:

Code: Select all

  // Create and set GDI Plus canvas.
  // This new canvas will be automatically destroyed when the chart
  // is freed.

  g:=TGDIPlusCanvas.Create;

  Chart1.Canvas:=g;

  // Some options for GDI Plus canvas
  g.AntiAlias:=True;
  g.AntiAliasText:=False;
You'll find an example of this, called GDIPlus, included with v7's binary installers.

With v8 we found that worked but there's a problem when trying to export the chart as we get an Access Violation error.

Could you please try if this works fine in v7? If so, is this what you were looking for?

Thanks in advance!

Posted: Fri Nov 28, 2008 4:13 pm
by 9337917
Narcís,

Apologies for it taking so long to respond, I've been (excitedly) playing with this. In concept it sounds like it might be a GREAT solution.

However, I'm running into problems within TeeGDIPlus. If a Build is done with Range Checking on, errors result.

Here's the Call Stack for one of them:
TGDIPlusCanvas.GDIPColor(13160660)
TGDIPlusCanvas.GBrush
TGDIPlusCanvas.FillRect((0, 0, 569, 337, (0, 0), (569, 337)))
TTeeCanvas3D.EraseBackground((0, 0, 569, 337, (0, 0), (569, 337)))
TCustomTeePanelExtended.FillPanelRect((0, 0, 569, 337, (0, 0), (569, 337)))
TCustomTeePanelExtended.PanelPaint((0, 0, 569, 337, (0, 0), (569, 337)))
TCustomAxisPanel.InternalDraw((0, 0, 569, 337, (0, 0), (569, 337)))
TCustomTeePanel.Draw($DF9560,(0, 0, 569, 337, (0, 0), (569, 337)))
TCustomTeePanel.Draw
TCustomTeePanel.Paint
TForm1.RadioGroup1Click($E03CB8)
TeeChartGDIPlus
Check out the value being passed to GDIPColor. It starts out from here, in DemoGDIPlus's RadioGroup1Click:

Code: Select all

   (Chart1.Canvas as TGDIPlusCanvas).AntiAlias:=CheckBox1.Checked;
Also, I found it possibly odd that in the middle of that call stack you see TTeeCanvas3D thrown in. I would expect there to be no calls to TTeeCanvas3D, or confusion to result if there is as to which canvas is involved. There, of course, I could be totally way off-base, and a TTeeCanvas3D routine is perfectly correct there.

So while in theory this might be a great approach for me to use, I'm having a few minor problems getting there.

Suggestions?

Regards,
richard diamond

Posted: Mon Dec 01, 2008 3:01 pm
by narcis
Hi richard,

Thanks for the information.

It seems the TeeGDIPlus unit in the GDIPluss demo is not in sync with the TeeGDIPlus with latest sourcecode release. Have you tried using TeeGDIPlus unit included with v7.12 sources? At least that's what happens with v8. If this doesn't work we could try sending you v8's version.

Thanks in advance.

Posted: Mon Dec 01, 2008 5:30 pm
by 9337917
Narcís,

Thank you for the offer! Yes, would you kindly send me either the TeeGDIPlus.Pas distributed with 7.12 source, or the 8.x one?

For some reason - no doubt Stupid Programmer Tricks on my part - all the TeeGDIPlus's on my system are from either March or July of 2004.

Thank you!

Regards,
richard diamond

Posted: Tue Dec 02, 2008 8:21 am
by narcis
Hi Richad,

Ok, it seems v7's TeeGDIPlus unit hasn't changed for quite a long time. However v8's is much more recent. I have sent you both.