Page 1 of 1
Add Offset to Axis
Posted: Wed Sep 10, 2008 8:22 am
by 10545590
Hi !
We use TChart to display measurement data. And often we (and of course our customers) have a situation like this:
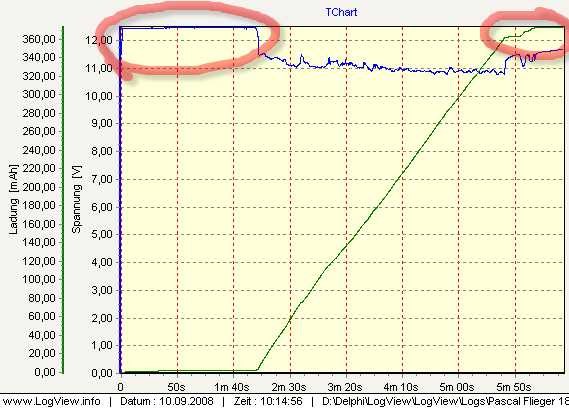
As you can see the two charts are at the top of the chart. So we need any solution to have an offset for the max axis value. Something like Maximumvalue + 10%. I know that there is an Offset property for each axis but this is calculated in pixel. This is not a really good solution.
The best way would be a rounding to the next integer value. For example if you have a maximum value of 12,56 the axis should have an end value of 13.
Can you give me a hint (or if possible some code) how we can achieve this?
Greetz
Dominik
Posted: Wed Sep 10, 2008 8:56 am
by narcis
Hi Dominik,
You already know min. and max. left axis values. Using Chart1.Axes.Left.CalcYPosValue method you can calculate the number of pixels used for a certain scale. Also, you can get axis size using Chart1.Axes.Left.IAxisSize. Knowing that you can calculate the number of pixels for setting MinimumOffset and MaximumOffset as you request.
Hope this helps!
Posted: Wed Sep 10, 2008 9:04 am
by 10545590
Hi Narcis,
and where should I place this code?
Which event would be the best for this?
Greetz Dominik
Posted: Wed Sep 10, 2008 9:08 am
by narcis
Hi Dominik,
You should place this in the OnAfterDraw event or call Chart1.Draw before because axes need to be plotted so that necessary properties have valid values.
Posted: Wed Sep 10, 2008 11:38 am
by 10545590
Hi Narcis,
I wrote a small demo but it works not the way I want it to do

Take a look at my project:
http://www.logview.info/Downloads/TopLine.zip
Use the radio button at the left side to get a new chart.draw. In Chart1AfterDraw is the calculation for the Offset.
But as you will see it will set to late. You start with MaximumOffset := 0. Then click on "Set to 900 max" which will add an offset. But nothing will happen. Click back to "do nothing" and you will get the offset.
Must I Call Chart.Draw in the Chart1AfterDraw Event?

This would draw the chart always twice compared to normal drawing.
Hope you can help me.
Greetz Dominik
Posted: Wed Sep 10, 2008 1:33 pm
by narcis
Hi Dominik,
Never use Draw method in OnAfterDraw event as you'd fall into an endless loop

.
Series2 is associated to Right axis. That's probably why you didn't notice the offset. Not using OnAfterDraw method and implementing SpacerClick as shown below works fine for me here.
Code: Select all
procedure TForm1.SpacerClick(Sender: TObject);
var Value, Diff : Double;
begin
  With Memo1.Lines, Chart1.Axes.Left do
  begin
    Clear;

    if Option_Aufrunden.Checked then begin
      Add('---------------------------------------');
      Add('Minimum Pixels  : ' + IntToStr(CalcYPosValue(Minimum)));
      Add('Minimum Value   : ' + FloatToStr(Minimum));
      Add('Maximum Pixels  : ' + IntToStr(CalcYPosValue(Maximum)));
      Add('Maximum Value   : ' + FloatToStr(Maximum));
      Add('IAxisSize       : ' + IntToStr(IAxisSize));

      Value := (Maximum - Minimum) / IAxisSize;
      Add('Float pro Pixel : ' + FloatToStr(Value));

      Diff  := 900 - Maximum;
      Add('Differenz       : ' + FloatToStr(Diff));
      Add('Pixels Offset   : ' + FloatToStr(Diff / Value));

      MaximumOffset := Trunc(Diff / Value);
    end
    else
      MaximumOffset := 0;

    Chart1.Axes.Right.MaximumOffset:=MaximumOffset;
    Add('MaximumOffset   : ' + IntToStr(MaximumOffset));
  end;
end;