Point3D with different color?
Posted: Sat May 31, 2008 11:12 am
Hi !
I have just started drawing GPS information to TChart. And it works very well (and easy) if I use TPoint3D.
But it would be great to have the lines between the 3D points in different colors. So it would be possible to view speed information within the GPS 3D data.
So it should look like this (the red / blue line):
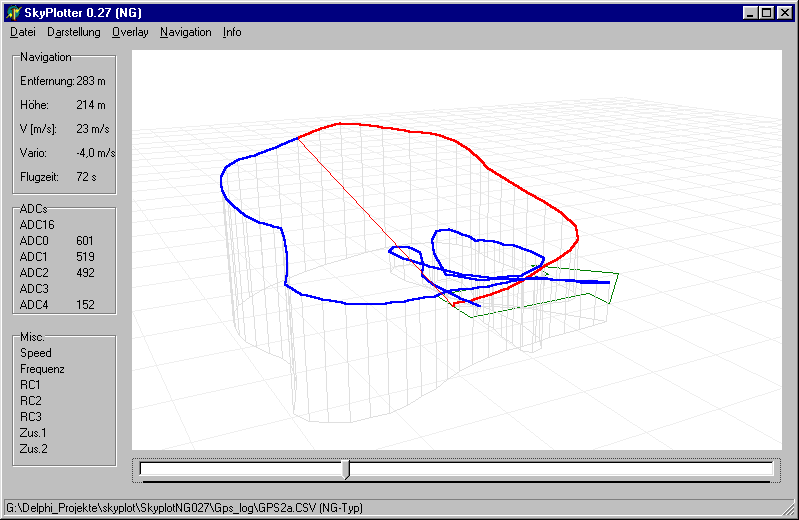
This example only uses two colors but I think you could imagine what I´m thinking about.
I tried something like this:
But in this case only the last color is used by TChart - for the whole graph.
Is it generally possible to have different colors for the lines between the 3D points?
I have just started drawing GPS information to TChart. And it works very well (and easy) if I use TPoint3D.
But it would be great to have the lines between the 3D points in different colors. So it would be possible to view speed information within the GPS 3D data.
So it should look like this (the red / blue line):
This example only uses two colors but I think you could imagine what I´m thinking about.
I tried something like this:
Code: Select all
  Series1.pen.color := RGB(255, 255, 0);
  Series1.AddXYZ(1, 2, 3);
  Series1.pen.color := RGB(255, 0, 0);
  Series1.AddXYZ(3, 20, 4);
  Series1.pen.color := RGB(0, 0, 255);
Series1.AddXYZ(3, 20, 40);Is it generally possible to have different colors for the lines between the 3D points?