Page 1 of 1
Display problem in area mode
Posted: Wed Jan 09, 2008 8:32 am
by 9342815
Hi,
We are facing a problem of curve display in area mode.
The serie is defined with following 6 points (X, Y) :
(1, 0)
(2, 0)
(2, 6)
(3, 6)
(4, 6)
(5, 6)
The serie pen width is 3, color is blue.
The serie color brush for area drawing is yellow.
On the rising edge (abscissa 2), the area drawing overlaps the blue line.
Is there a way to avoid this behaviour ?
Thx
Posted: Wed Jan 09, 2008 12:10 pm
by narcis
Hi Nico,
Using TeeChart Pro v8.02 VCL I've created a chart as you described using this code:
Code: Select all
  With Series1 do
  begin
    Pen.Color:=clBlue;
    Pen.Width:=3;
    AreaColor:=clYellow;
    AddXY(1, 0);
    AddXY(2, 0);
    AddXY(2, 6);
    AddXY(3, 6);
    AddXY(4, 6);
    AddXY(5, 6);
  end;
Which produce this chart:
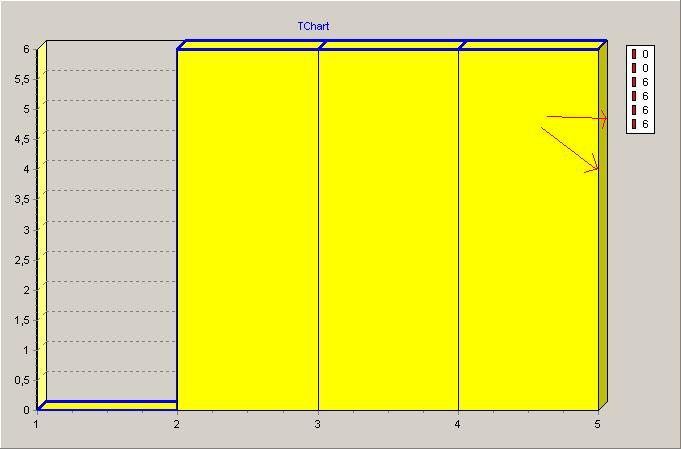
Can you please confirm that the lines you mean are the ones pointed by the arrows I drew to the chart?
Thanks in advance.
Posted: Fri Jan 11, 2008 1:47 pm
by 9342815
Hi,
Thank you very much for your quick answer.
I am sorry but I forgot to give details concerning my environment :
- TeeChart PRO v7.11 VCL
- coding with CodeGear DELPHI2007
- using 2d series
Our problem is that blue line on rising-edge at abscissa 2 has a width of 1 instead of 3.
Tell me if it is better that I send you a screenshot.
Thanks again.
Posted: Fri Jan 11, 2008 2:04 pm
by narcis
Hi Nico,
Yes, please. Could you send your files at news://
www.steema.net/steema.public.attachments newsgroup or at our
upload page?
Thanks in advance!
Posted: Tue Jan 15, 2008 7:47 am
by 9342815
Hi,
I've uploaded the screenshot in my upload page.
Thanks for your help
Posted: Tue Jan 15, 2008 9:25 am
by narcis
Hi Nico,
Thanks for the image.
I've checked that this works fine for me here using v7.12 (latest v7 release available), adding a TChart with a TAreaSeries in a form and this code:
Code: Select all
  Series1.Pen.Color:=clBlue;
  Series1.Pen.Width:=3;
  Series1.AreaColor:=clYellow;

  Series1.AddXY(0,0);
  Series1.AddXY(1,0);
  Series1.AddXY(1,5);
  Series1.AddXY(2,5);

  Chart1.Axes.Left.MaximumOffset:=10;
  Chart1.Axes.Left.MinimumOffset:=10;
The resulting chart is this:

Could you please check if v7.12 works fine at your end or could you please modify the code so that we can reproduce the code here?
Thanks in advance.
Posted: Tue Jan 15, 2008 10:51 am
by 9342815
Hi,
You can reproduce the problem adding the line :
Code: Select all
Series1.AreaLinesPen.Visible := FALSE;
You will note that line width on the rising edge is half the defined width.
Thanks
Posted: Tue Jan 15, 2008 10:59 am
by narcis
Hi Nico,
Thanks for the information. I've been able to reproduce the issue now and added it (TV52012727) to our defect list to be fixed for future releases.