Page 1 of 1
ChartGrid: legend disappears if ColWidth = 0
Posted: Wed May 31, 2006 5:23 pm
by 5886551
I like to hide the columns of x-values for all series but the first because they are identical for all series. I found a suggested trick from the user forum or newsgroup: to set the column width to zero. That works but the legend for the series in the first row disappears two. I see only 'Y' over each column, so the columns are not described anymore. How can I prevent this?
Kind regards,
Rolf
Posted: Thu Jun 01, 2006 9:06 am
by narcis
Hi Rolf,
I'm not able to reproduce the issue here using TeeChart Pro v7.07. Could you please send us an example we can run "as-is" to reproduce the problem here and let us know which TeeChart version are you using?
You can post your files at news://
www.steema.net/steema.public.attachments newsgroup.
Thanks in advance.
Posted: Thu Jun 01, 2006 12:26 pm
by 5886551
Ok, I use an older version 5.03 Pro. So, is this the point?
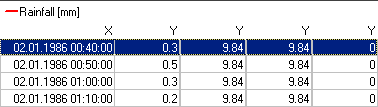
Here you see a screen dump of the chartgrid. Only the first series has a legend because there the x-value column is visible. For the other series the legend is not visible because the column width of x-values is set to zero.
By the way: Is it possible to define only one x-array for different fast line series to save memory? I must display many time series with same x-values . Each time series have 500'000 to 1'200'000 points. I use paging to display parts of the data. Is it possible to page by month or year, if I have a datetime value as x-value? Now, I have a constant number of points per page, but months have different lengths. Therefore after some pages (months) the page is shift to the middle of a month. How can I prevent this?
Kind regards,
Rolf
Posted: Thu Jun 08, 2006 2:12 pm
by Pep
Hi Rolf,
Ok, I use an older version 5.03 Pro. So, is this the point?
No, it's because the Title of the Series is dislplayed into the X column and changing it's width to 0 makes to be not visible. a solution (if all the X values are the same) use the Text column (label for Series) to show the XValue, you will have to add the Xvalues as a labels too and then just setting the ShowXValues property to cgsNo should appear what you want.
By the way: Is it possible to define only one x-array for different fast line series to save memory? I must display many time series with same x-values . Each time series have 500'000 to 1'200'000 points
Yes. you could use similar code to the one that can be found in the Demo Features project under : All Features -> Welcome ! -> Speed -> Fast Dynamic Arrays
Is it possible to page by month or year, if I have a datetime value as x-value? Now, I have a constant number of points per page, but months have different lengths. Therefore after some pages (months) the page is shift to the middle of a month. How can I prevent this?
This cannot be done automatically, but you can do it manuyally, setting the axis scales to specific range. There's an example that could help you on this at :
http://www.steema.com/support/Tutorials ... l_0002.htm
out of memory if try to create xlabels for one series
Posted: Mon Jun 12, 2006 2:47 pm
by 5886551
use the Text column (label for Series) to show the XValue, you will have to add the Xvalues as a labels too and then just setting the ShowXValues property to cgsNo should appear what you want.
I set ShowXValues to cgsNo and ShowLables to true then I see a column Text which is empty. I tried to fill the labels of my first series with the datetime string as follows:
Series1->XLabel
= DateTimeToStr(curDateTime);
(slow and memory-consuming!)
If I have several series (as in my case), how is determined which series x-label is shown in the Text column?
As expected I got an out of memory-error because I have around 500'000 data points. So I created to many strings! How can I fill the Text column with the DateTime strings? But I fear it is slow and memory-consuming in any case!
Posted: Thu Jun 15, 2006 9:35 am
by narcis
Hi Rolf,
The Text column shows the labels of the first series which has them. So you could only add labels for the series you want to be displayed in the Text column.
It would also help you reading
this article on how to optimize TeeChart's performance. Combining the labels approach and the article I cam up with the code below. Is this acceptable for you?
Code: Select all
procedure TForm1.FormCreate(Sender: TObject);
var i,j : Integer;
begin
  InitChart;

  for i:=0 to Chart1.SeriesCount-1 do
    InitSeries(Chart1[i]);

  for j:=0 to Series1.Count-1 do
    Series1.XLabel[j] := DateTimeToStr(now);

  //You'll need to refresh the grid if setting labels separately.
  //ChartGrid1.Refresh;

  ChartGrid1.ShowXValues:=cgsNo;
  ChartGrid1.ShowLabels:=true;
end;

procedure TForm1.InitSeries(ASeries: TChartSeries);
Var X,Y : Array of Double;   // TChartValues
    t   : Integer;
    Num : Integer;
begin
  With (ASeries as TFastLineSeries) do
  begin
    FastPen:=true;
    DrawAllPoints:=false;
    AutoRepaint:=false;
    LinePen.OwnerCriticalSection := nil;
  end;

  Num:= 500000;

  { allocate our custom arrays }
  SetLength(X,Num);
  SetLength(Y,Num);

  { fill data in our custom arrays }
  X[0]:=0;
  Y[0]:=Random(10000);
  for t:=1 to Num-1 do
  begin
    X[t]:=t;
    Y[t]:=Y[t-1]+Random(101)-50;
  end;

  { set our X array }
  With ASeries.XValues do
  begin
    Value:=TChartValues(X);  { <-- the array }
    Count:=Num;               { <-- number of points }
    Modified:=True;           { <-- recalculate min and max }
  end;

  { set our Y array }
  With ASeries.YValues do
  begin
    Value:=TChartValues(Y);
    Count:=Num;
    Modified:=True;
  end;

  { Show data }
  Series1.Repaint;
end;

procedure TForm1.InitChart;
begin
  with Chart1 do
  begin
    ClipPoints := False;
    Title.Visible := False;
    Legend.Visible := False;
    With Axes do
    begin
      Left.Axis.Width:=1;
      Bottom.Axis.Width:=1;
      Bottom.RoundFirstLabel := False;
      FastCalc := True;
    end;
    View3D := False;
    Canvas.ReferenceCanvas.Pen.OwnerCriticalSection := nil;
  end;
end;