TBarseries wrong barwidth on not automatic axis
Posted: Tue Nov 10, 2009 2:53 pm
Hello !
I use TChart 7.12 VCL. You can produce the error with the TChart-Editor:
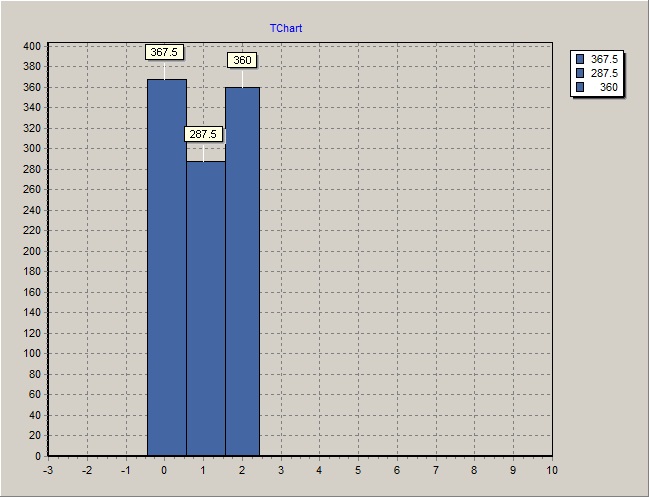
Insert a TBarseries fill it with 3 samples. The x-Points are:
0. Bar -0.5 .. 0.5
1.Bar 0.5 .. 1.5
3. Bar 1.5 .. 2.5
Thats ok, but when you widen the x-Axis range maybe to -3 .. 10
the bar have different width and position.
I could not figure out whats the rule for this.
0. Bar -1.8 .. 0.8
1. Bar 0.8 .. 0.5
2. Bar 0.5 .. 3.8 !!!!!!!
So the last bar is always very large.
The %BarWith is 100.
For SideMargins off you get -2 to -1 to 0 to 4
I expected the bars should be centered at 0, 1, 2, 3 etc. with width 1.
Is this a bug or must I configure something ???
Bye
Andreas Weichert
I use TChart 7.12 VCL. You can produce the error with the TChart-Editor:
Insert a TBarseries fill it with 3 samples. The x-Points are:
0. Bar -0.5 .. 0.5
1.Bar 0.5 .. 1.5
3. Bar 1.5 .. 2.5
Thats ok, but when you widen the x-Axis range maybe to -3 .. 10
the bar have different width and position.
I could not figure out whats the rule for this.
0. Bar -1.8 .. 0.8
1. Bar 0.8 .. 0.5
2. Bar 0.5 .. 3.8 !!!!!!!
So the last bar is always very large.
The %BarWith is 100.
For SideMargins off you get -2 to -1 to 0 to 4
I expected the bars should be centered at 0, 1, 2, 3 etc. with width 1.
Is this a bug or must I configure something ???
Bye
Andreas Weichert