Post
by Janusz_Cichocki » Thu May 28, 2009 10:53 am
Hello,
thank you for answer but
There are still the same errors :
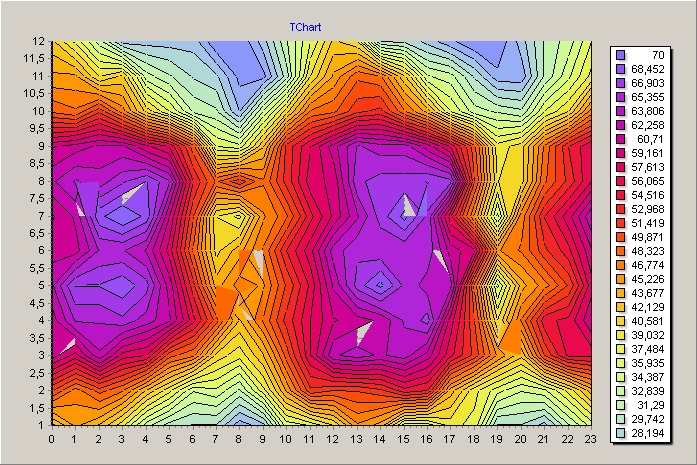
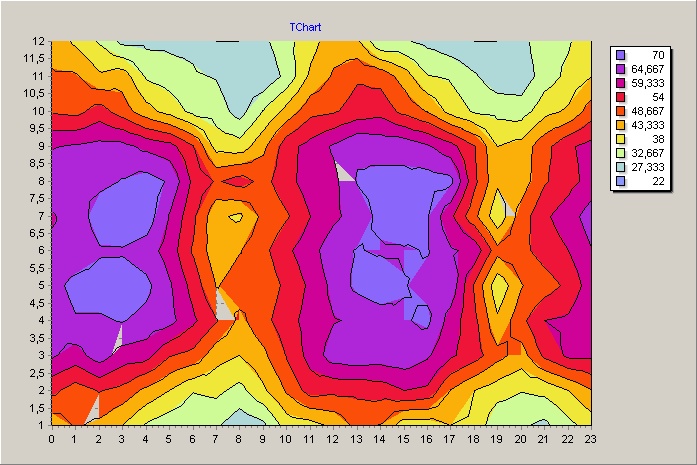
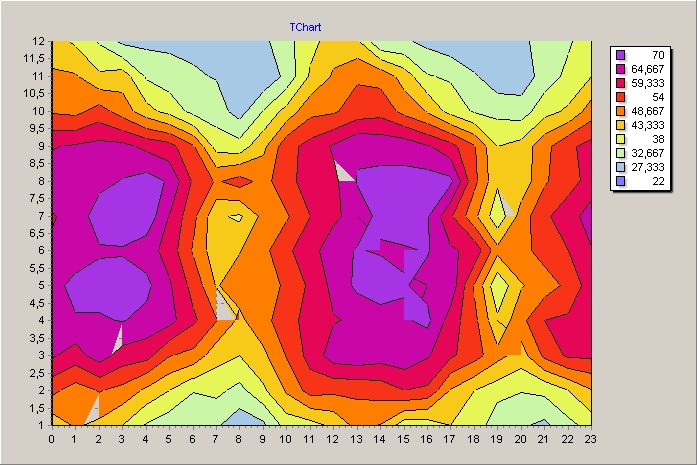
1.white tringules on contour surface
2.Differents between isolines and filled area
I use Delphi 7 and TeeChart v. 8.05
I will send CONTOUR.BMP as result of that unit.
I have prepared as simple version of that unit as possible :
Any idea about that problem ?
Janusz
unit SawIsE;
interface
uses
Windows, Messages, SysUtils, Variants, Classes, Graphics, Controls, Forms,
Dialogs, TeEngine, TeeSurfa, ExtCtrls, TeeProcs, Chart,
TeeBMPOptions;
type
TSawIsEForm = class(TForm)
Chart1: TChart;
Series1: TContourSeries;
procedure FormActivate(Sender: TObject);
procedure FormClose(Sender: TObject; var Action: TCloseAction);
private
{ Private declarations }
public
{ Public declarations }
end;
var
SawIsEForm: TSawIsEForm;
Procedure IsoSurfaceExample;
implementation
{$R *.dfm}
const
MYMAP : Array [01..12, 00..23] of single = (
{01}(40,44,42,38,32,29,28,28,24,26,35,36,39,45,43,35,35,38,37,28,28,26,31,35),
{02}(50,46,49,47,42,38,33,34,31,37,44,51,50,50,51,54,53,43,38,35,33,34,38,43),
{03}(60,57,62,57,56,49,47,40,38,42,49,56,62,63,62,63,60,55,51,45,41,50,55,55),
{04}(60,64,64,65,63,61,55,49,42,47,52,56,59,60,61,64,66,57,50,39,47,54,55,59),
{05}(62,67,67,68,66,60,52,43,46,45,50,55,61,66,69,65,63,63,48,34,43,46,50,57),
{06}(60,60,64,64,62,57,48,40,43,47,53,57,63,65,64,64,65,60,58,45,47,51,54,59),
{07}(59,61,68,70,68,59,50,39,37,45,48,54,58,62,66,69,65,55,45,34,46,53,57,62),
{08}(62,64,63,65,67,64,53,48,51,47,52,57,58,65,66,66,67,66,50,39,40,48,52,56),
{09}(59,60,61,61,58,56,49,36,35,42,52,56,60,64,63,63,60,56,49,38,40,47,53,56),
{10}(48,47,51,46,40,36,31,30,25,33,40,47,48,51,52,47,43,36,32,31,30,36,39,46),
{11}(44,44,39,41,32,30,28,27,23,23,29,39,44,48,47,41,33,32,28,24,24,30,34,38),
{12}(41,37,32,26,26,26,26,22,22,26,31,36,41,39,28,28,26,24,22,22,26,30,32,36));
MYSTEP = 15;
ColorPalette : array [0..MYSTEP] of TColor =
(
$000000, $ff0000, $ff8000, $ffc000,
$ffff00, $c0ff00, $80ff00, $00ff00,
$00ff80, $00ffff, $00dfff, $00c0ff,
$00a0ff, $0080ff, $0060ff, $0000ff
);
Procedure IsoSurfaceExample;
{=========================}
begin
SawIsEForm := TSawIsEForm.Create (NIL);
with SawIsEForm do begin
ShowModal;
end;
FreeAndNIL (SawIsEForm);
end;
procedure TSawIsEForm.FormActivate(Sender: TObject);
var
M, H : Byte;
begin
with Series1 do begin
Brush.Style := bsSolid;
{MONTHS}
for M := 1 to 12 do begin
{HOURS}
for H := 00 to 23 do begin
AddXYZ (H, MYMAP [M, H], M);
end;
end;
Active := TRUE;
end;
end;
procedure TSawIsEForm.FormClose(Sender: TObject; var Action: TCloseAction);
begin
(*
with TBMPExportFormat.Create do begin
Panel := Chart1;
SaveToFile ('\METEO\RAPO\CONTOUR.BMP');
Free;
end;
*)
end;