Page 1 of 1
Custom Axis label format
Posted: Mon Feb 28, 2011 4:23 pm
by 15052741
Hi everybody.
I am trying to work with axis labels and I would like to have the values formatted as scientific notation like as:
1.3x10⁻² (-2 in superscript) instead of 1.3E-2.
Is there an easy way to do that ?
Re: Custom Axis label format
Posted: Tue Mar 01, 2011 11:12 am
by 10050769
Hello Angelo,
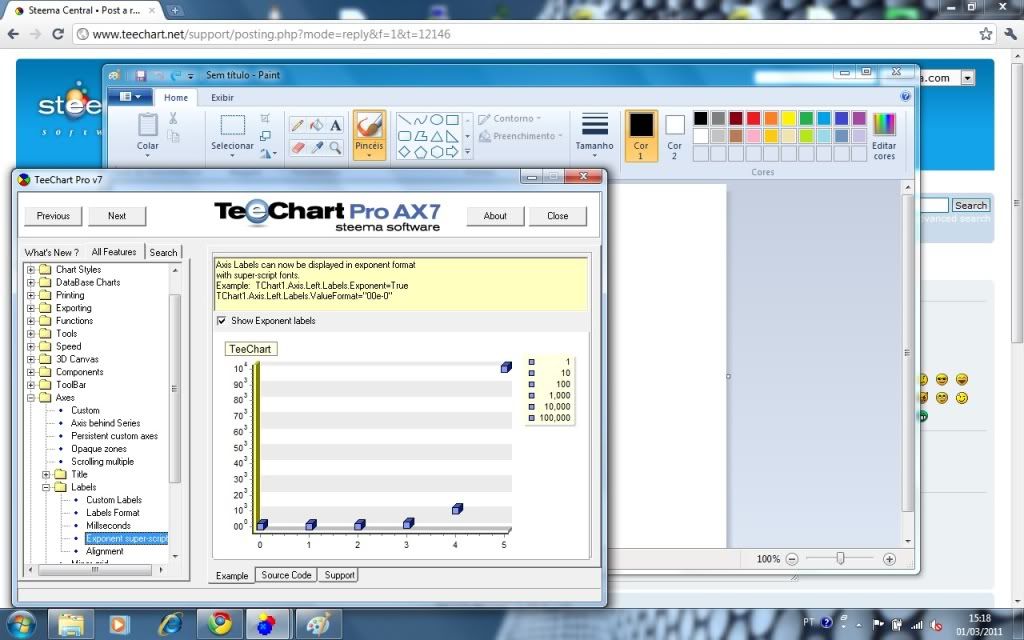
I recommend take a look to TeeChart Activex Demo project concretely to All Features\Axes\Labels\Exponent super-script. If you have any problem, please let me know.
I hope will helps.
Thanks,
Re: Custom Axis label format
Posted: Tue Mar 01, 2011 11:49 am
by 15052741
Hi Sandra. I checked that example and tried it, but it does not work accordingly.
Suppose I have the following data (X,Y)
(11,0.0005324)
(37,0.0007876)
(40,0.0010203)
if formatted as: "0.000E+0" the Y axis labels should be displayed as:
5.324x10(-4)
7.876x10(-4)
1.020x10(-3)
where (-4) and (-3) are the superscripts. The axis labels should be as written as above, but I it is not displayed because the format string "E-0" is not converted to "x10(-n)" where n is the superscript.
A "ugly" workaround for this I did setting the formatvalue="0.000x1OE-0" where I changed a "0" by "O" so I get:
5.324x1O(-4)
7.876x1O(-4)
1.020x1O(-3)
Re: Custom Axis label format
Posted: Tue Mar 01, 2011 6:23 pm
by 15052741
Hi Sandra I just noticed that the problem also occurs with the demo !!!
See the legend and the vertical axis labels !
Re: Custom Axis label format
Posted: Wed Mar 02, 2011 10:09 am
by yeray
Hi Angelo,
The following code seems to work fine for me here:
Code: Select all
Private Sub Form_Load()
  TChart1.Aspect.View3D = False

  TChart1.AddSeries scPoint
  TChart1.Series(0).AddXY 11, 0.0005324, "", clTeeColor
  TChart1.Series(0).AddXY 37, 0.0007876, "", clTeeColor
  TChart1.Series(0).AddXY 40, 0.0010203, "", clTeeColor

  TChart1.Axis.Left.Labels.ValueFormat = "#.000 ""x10"" E+0"
  TChart1.Axis.Left.Labels.Exponent = True
End Sub

Private Sub TChart1_OnGetLegendText(ByVal LegendStyle As Long, ByVal ValueIndex As Long, LegendText As String)
  If LegendStyle = lsValues Then
    LegendText = Format$(TChart1.Series(0).YValues.Value(ValueIndex), "#.000 ""x10"" E+0")
  End If
End Sub
In TeeChart v2010 there is an AxisStyle named PointValue, only available at designtime for now. With it and the code above, the chart looks as follows:

- Chart.png (7.78 KiB) Viewed 13968 times
In v7, the same code produces the following result:

- Chart2.png (8.73 KiB) Viewed 13962 times
And zooming around the second point, it looks as follows:

- Chart3.png (8.52 KiB) Viewed 13960 times
Isn't it what you are trying to achieve?