Page 1 of 1
How to create a simple side by side chart?
Posted: Thu May 27, 2010 12:47 pm
by 6921343
How do i create a simple chart like this
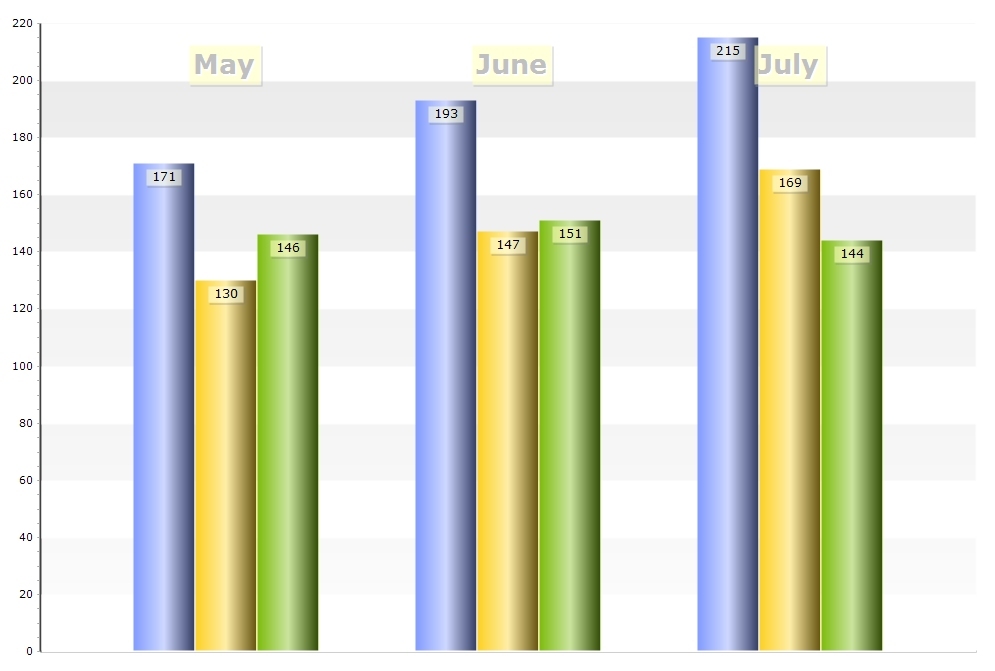
?
Please give example only for month May. I am using TeeChart Pro v8.
Thanks
Re: How to create a simple side by side chart?
Posted: Thu May 27, 2010 3:57 pm
by yeray
Hi Kjell,
Here is how you could have a chart very similar to the one in your picture.
Code: Select all
Private Sub Form_Load()
  TChart1.Aspect.View3D = False

  Dim i As Integer
  For i = 0 To 2
    TChart1.AddSeries scBar
  Next i

  With TChart1.Series(0)
    .Add 171, "May", clTeeColor
    .Add 193, "June", clTeeColor
    .Add 215, "July", clTeeColor
    .asBar.BarStyle = bsRectGradient
    .Color = RGB(55, 55, 255)
    .asBar.Gradient.MidColor = RGB(155, 155, 255)
    .asBar.Gradient.StartColor = RGB(0, 0, 155)
    .asBar.Gradient.Direction = gdLeftRight
    .Marks.Style = smsValue
  End With

  With TChart1.Series(1)
    .Add 130, "May", clTeeColor
    .Add 147, "June", clTeeColor
    .Add 169, "July", clTeeColor
    .asBar.BarStyle = bsRectGradient
    .Color = RGB(200, 200, 0)
    .asBar.Gradient.MidColor = RGB(255, 255, 155)
    .asBar.Gradient.StartColor = RGB(100, 100, 55)
    .asBar.Gradient.Direction = gdLeftRight
    .Marks.Style = smsValue
  End With

  With TChart1.Series(2)
    .Add 146, "May", clTeeColor
    .Add 151, "June", clTeeColor
    .Add 144, "July", clTeeColor
    .asBar.BarStyle = bsRectGradient
    .Color = RGB(116, 160, 24)
    .asBar.Gradient.MidColor = RGB(165, 245, 160)
    .asBar.Gradient.StartColor = RGB(43, 73, 12)
    .asBar.Gradient.Direction = gdLeftRight
    .Marks.Style = smsValue
  End With

  TChart1.Tools.Add tcGridBand
  TChart1.Tools.Items(0).asGridBand.Axis = TChart1.Axis.Left
  TChart1.Tools.Items(0).asGridBand.Band1.Color = RGB(200, 200, 200)
  TChart1.Tools.Items(0).asGridBand.Band2.Color = vbWhite

  TChart1.Axis.Left.GridPen.Visible = False
  TChart1.Axis.Left.Increment = 20
  TChart1.Axis.Bottom.GridPen.Visible = False

  TChart1.Panel.Color = vbWhite

  TChart1.Environment.InternalRepaint
  For i = 0 To TChart1.Series(0).Count - 1
    TChart1.Tools.Add tcAnnotate
    With TChart1.Tools.Items(i + 1).asAnnotation
      .Shape.Font.Size = 20
      .Text = TChart1.Series(0).PointLabel(i)
      .Shape.Font.Bold = True
      .Shape.Font.Name = "Meiryo UI"
      .Shape.Font.Color = vbGrayText
      .Left = TChart1.Axis.Bottom.CalcXPosValue(i) - TChart1.Canvas.TextWidth(.Text)
      .Top = 50
      .Shape.Color = RGB(255, 255, 170)
    End With
  Next i
End Sub
Re: How to create a simple side by side chart?
Posted: Fri May 28, 2010 9:30 am
by 6921343
Thanks you. One more question. How can i change the labels on bars? Instead of numbers i need my own text on every bar. I am making chart showing statistics for users progress. For instance, user with name John having value of 171, user with name Thomas has value of 130 etc for those 3 months.
I'm writing in C#
EDIT: i found a solution for it. I used Title values like this tChart1.Series(y).Marks.Style = TeeChart.EMarkStyle.smsSeriesTitle;
Now i need colors of the bars to be like the colors of title squares on the top right of the chart which is not shown on the chart posted in first post. Hope you know what i mean
Thanks
Re: How to create a simple side by side chart?
Posted: Fri May 28, 2010 9:56 am
by yeray
Hi Kjell,
Kjell wrote:EDIT: i found a solution for it. I used Title values like this tChart1.Series(y).Marks.Style = TeeChart.EMarkStyle.smsSeriesTitle;
I'm happy to hear you've found it!
Kjell wrote:Now i need colors of the bars to be like the colors of title squares on the top right of the chart which is not shown on the chart posted in first post. Hope you know what i mean
Do you mean the legend? In the example I wrote I used 3 color gradient for each bar series. If you want the legend symbols to show gradients too:
Code: Select all
TChart1.Legend.Symbol.Gradient.Visible = True
If you want both the bar series and the legend symbols to show solid colors, simply delete the lines where I set up the series gradients:
Code: Select all
    .asBar.BarStyle = bsRectGradient
    .asBar.Gradient.MidColor = RGB(165, 245, 160)
    .asBar.Gradient.StartColor = RGB(43, 73, 12)
    .asBar.Gradient.Direction = gdLeftRight