
 ?
?Please give example only for month May. I am using TeeChart Pro v8.
Thanks
?Code: Select all
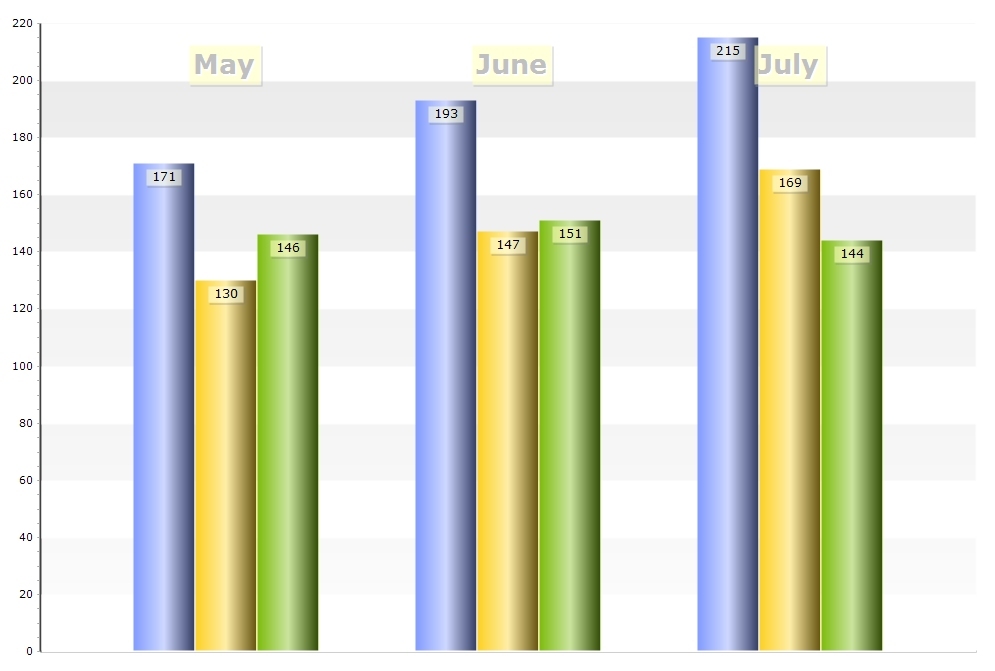
Private Sub Form_Load()
  TChart1.Aspect.View3D = False

  Dim i As Integer
  For i = 0 To 2
    TChart1.AddSeries scBar
  Next i

  With TChart1.Series(0)
    .Add 171, "May", clTeeColor
    .Add 193, "June", clTeeColor
    .Add 215, "July", clTeeColor
    .asBar.BarStyle = bsRectGradient
    .Color = RGB(55, 55, 255)
    .asBar.Gradient.MidColor = RGB(155, 155, 255)
    .asBar.Gradient.StartColor = RGB(0, 0, 155)
    .asBar.Gradient.Direction = gdLeftRight
    .Marks.Style = smsValue
  End With

  With TChart1.Series(1)
    .Add 130, "May", clTeeColor
    .Add 147, "June", clTeeColor
    .Add 169, "July", clTeeColor
    .asBar.BarStyle = bsRectGradient
    .Color = RGB(200, 200, 0)
    .asBar.Gradient.MidColor = RGB(255, 255, 155)
    .asBar.Gradient.StartColor = RGB(100, 100, 55)
    .asBar.Gradient.Direction = gdLeftRight
    .Marks.Style = smsValue
  End With

  With TChart1.Series(2)
    .Add 146, "May", clTeeColor
    .Add 151, "June", clTeeColor
    .Add 144, "July", clTeeColor
    .asBar.BarStyle = bsRectGradient
    .Color = RGB(116, 160, 24)
    .asBar.Gradient.MidColor = RGB(165, 245, 160)
    .asBar.Gradient.StartColor = RGB(43, 73, 12)
    .asBar.Gradient.Direction = gdLeftRight
    .Marks.Style = smsValue
  End With

  TChart1.Tools.Add tcGridBand
  TChart1.Tools.Items(0).asGridBand.Axis = TChart1.Axis.Left
  TChart1.Tools.Items(0).asGridBand.Band1.Color = RGB(200, 200, 200)
  TChart1.Tools.Items(0).asGridBand.Band2.Color = vbWhite

  TChart1.Axis.Left.GridPen.Visible = False
  TChart1.Axis.Left.Increment = 20
  TChart1.Axis.Bottom.GridPen.Visible = False

  TChart1.Panel.Color = vbWhite

  TChart1.Environment.InternalRepaint
  For i = 0 To TChart1.Series(0).Count - 1
    TChart1.Tools.Add tcAnnotate
    With TChart1.Tools.Items(i + 1).asAnnotation
      .Shape.Font.Size = 20
      .Text = TChart1.Series(0).PointLabel(i)
      .Shape.Font.Bold = True
      .Shape.Font.Name = "Meiryo UI"
      .Shape.Font.Color = vbGrayText
      .Left = TChart1.Axis.Bottom.CalcXPosValue(i) - TChart1.Canvas.TextWidth(.Text)
      .Top = 50
      .Shape.Color = RGB(255, 255, 170)
    End With
  Next i
End Sub
 | Yeray Alonso Development & Support Steema Software Av. Montilivi 33, 17003 Girona, Catalonia (SP) |
      |
Please read our Bug Fixing Policy |
I'm happy to hear you've found it!Kjell wrote:EDIT: i found a solution for it. I used Title values like this tChart1.Series(y).Marks.Style = TeeChart.EMarkStyle.smsSeriesTitle;
Do you mean the legend? In the example I wrote I used 3 color gradient for each bar series. If you want the legend symbols to show gradients too:Kjell wrote:Now i need colors of the bars to be like the colors of title squares on the top right of the chart which is not shown on the chart posted in first post. Hope you know what i mean
Code: Select all
TChart1.Legend.Symbol.Gradient.Visible = TrueCode: Select all
    .asBar.BarStyle = bsRectGradient
    .asBar.Gradient.MidColor = RGB(165, 245, 160)
    .asBar.Gradient.StartColor = RGB(43, 73, 12)
.asBar.Gradient.Direction = gdLeftRight | Yeray Alonso Development & Support Steema Software Av. Montilivi 33, 17003 Girona, Catalonia (SP) |
| |
Please read our Bug Fixing Policy |
